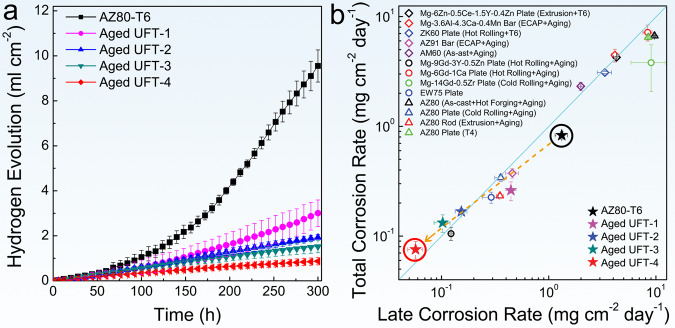
Fig. 3. Corrosion rates in 3 wt.% NaCl solution.
(a) Corrosion rates as a function of time determined from the volume of hydrogen emitted. b Comparison of the corrosion rates between the aged UFT samples and typical precipitate-hardened Mg–Al, Mg–Zn, and Mg–RE alloys. Error bars in (a) and (b) represent one standard deviation of the data from the mean. The x-axis is the corrosion rate for the last 24 h and the y-axis is the average corrosion rate for 300 h. If the symbol is above the blue line, the corrosion rate decreases with time, otherwise it increases with time. ECAP in (b) refers to an equal channel angular process.

