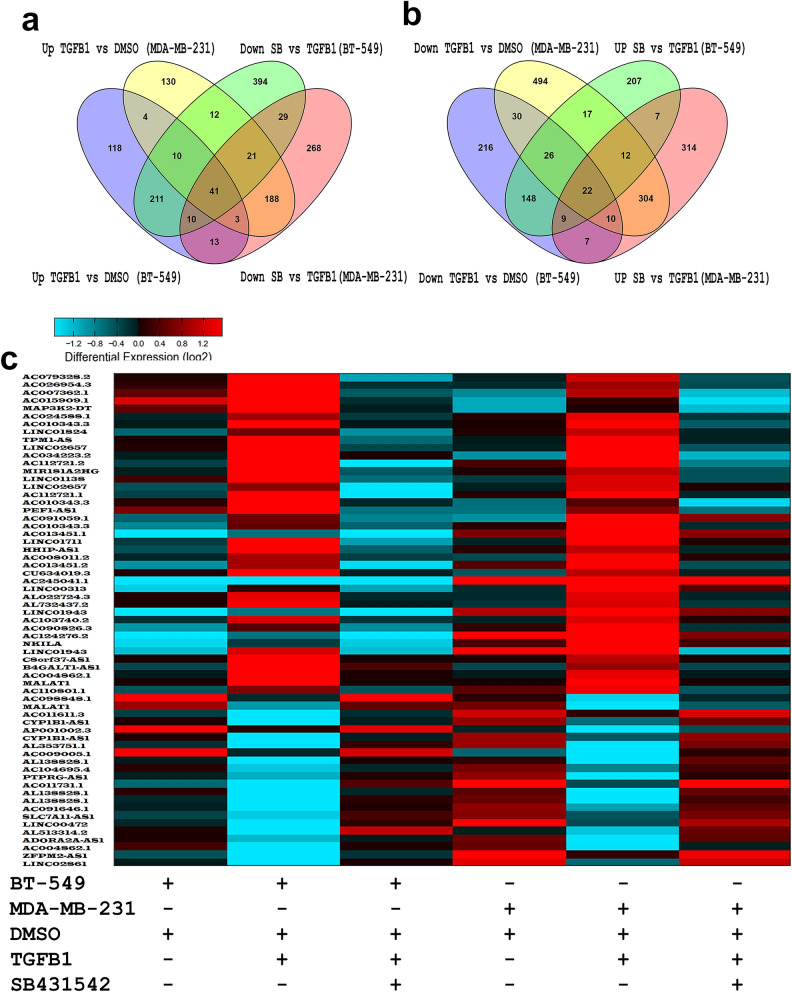
Figure 4.
Venn diagraph depicting the overlap in upregulated (a) or downregulated (b) lncRNAs in BT-549 and MDA-MB-231 under the indicated experimental conditions. Upregulated genes are defined as the genes upregulated (FC ≥ 2.0) by TGFB1 and those were downregulated (FC ≤ 2.0) by SBSB431542. Downregulated genes were defined as the genes downregulated (FC ≤ 2.0) by TGFB1 and those were induced (FC ≥ 2.0) by SB431542. (c) Heatmap depicting commonly altered (up and down) lncRNAs under different experimental conditions.

