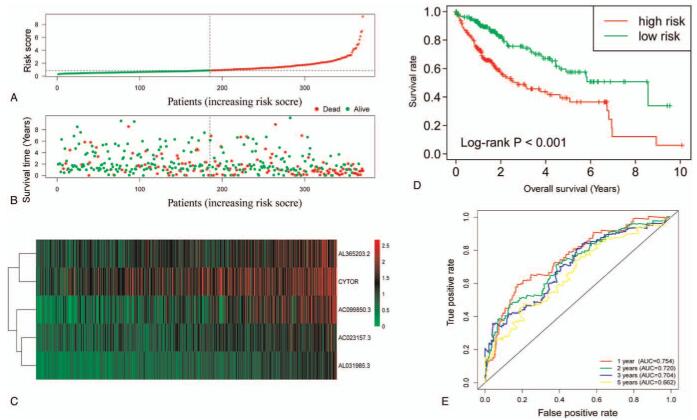
Figure 3.
The risk score model analysis of the 5 prognostic ERL's signature. Note: (A)The rank of risk score, (B) survival outcome, and (C) expression heat map of the 5 prognostic ERLs between the high- and low-risk groups. (D) Kaplan–Meier curves for the high- and low-risk groups. (E) Time-dependent ROC analysis based on the risk score of patients with HCC.

