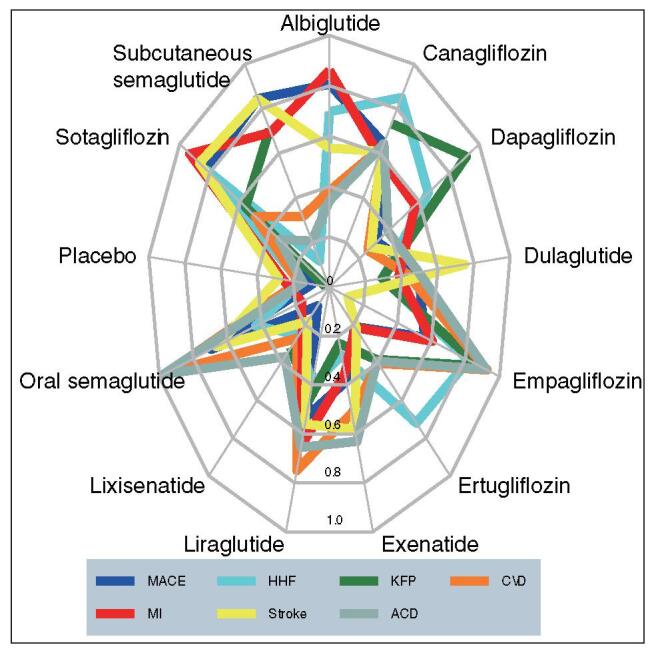
Figure 1.

Radar plot of SUCRA values of 12 drug interventions for preventing 7 cardiorenal outcomes in T2D patients. ACD = all-cause death, CVD = cardiovascular death, HHF = hospitalization for heart failure, MI = myocardial infarction, KFP = kidney function progression, MACE = major adverse cardiovascular events, SUCRA = surface under the cumulative ranking curve, T2D = type 2 diabetes.
