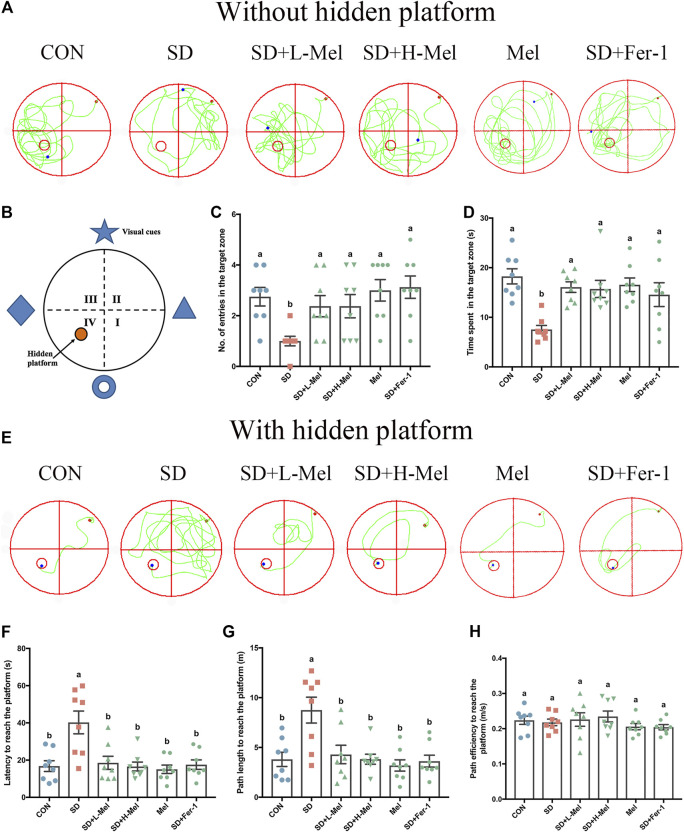
FIGURE 2.
Effect of melatonin on ability of learning and memory in sleep-deprived mice. (A) Track plot of spatial memory test (without hidden platform). (B) Schematic of the Morris water maze. (C) Number of entries into the target zone (n = 8). (D) Time spent in the target zone (n = 8). (E) Track plot of spatial memory test (with hidden platform). (F) Latency to reach the platform (n = 8). (G) Path length to reach the platform (n = 8). (H) Path velocity to reach the platform (n = 8). Differences were assessed using one-way ANOVA. The result represents the mean ± standard error of the mean. Values not sharing a common superscript letter differ significantly at p < 0.05; those with the same letter do not differ significantly (p ≥ 0.05). CON: control group, SD: sleep deprivation group, SD + L-Mel: SD + low melatonin (20 mg/kg) supplement group, SD + H-Mel: SD + high melatonin (40 mg/kg) supplement group, Mel: melatonin (20 mg/kg) supplement group, SD + Fer-1: SD + Fer-1 (1 mg/kg) supplement group.

