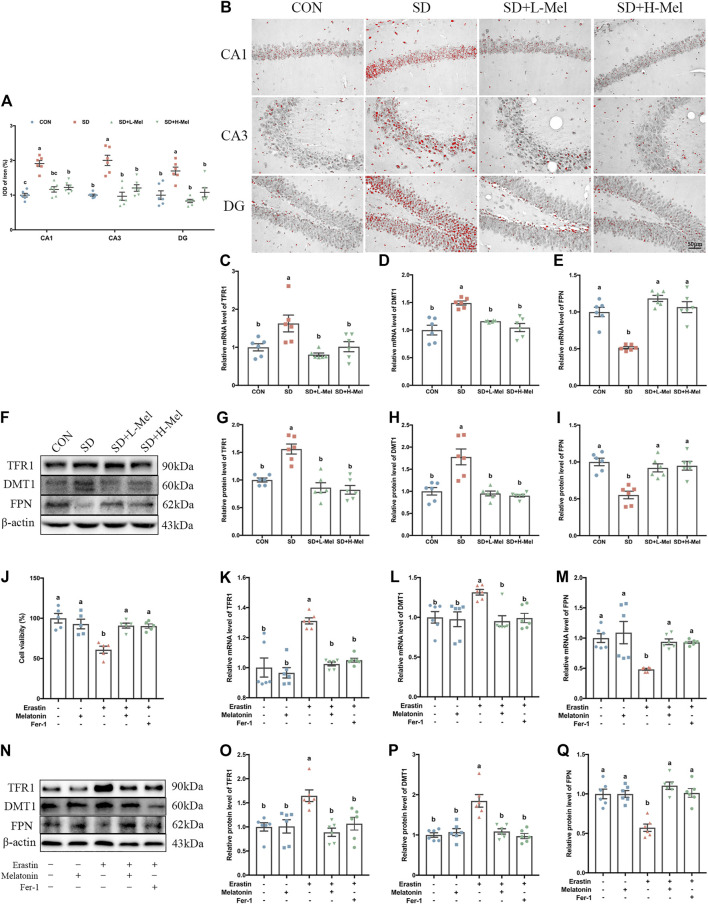
FIGURE 3.
Effect of melatonin on iron accumulation and iron transporter proteins in the hippocampus of sleep-deprived mice. (A) Relative IOD of iron-positive cells in the hippocampal CA1, CA3, and DG areas (n = 6). (B) Micrographs depict iron labeling in mouse hippocampal sections. The iron-staining results were processed using ImageJ. Iron deposits were observed as red granules. Bar = 50 μm. (C–E) Relative mRNA levels of iron transporter proteins TFR1, DMT1 and FPN in the hippocampus (n = 6). (F–I) Relative protein levels of iron transporter proteins TFR1, DMT1 and FPN in the hippocampus (n = 6). (J) Relative cell viability (n = 5). (K–L) Relative mRNA levels of iron transporter proteins TFR1, DMT1 and FPN in HT-22 cells exposed to Erastin and melatonin or Fer-1 (n = 6). (N–Q) Relative protein levels of iron transporter proteins TFR1, DMT1 and FPN in HT-22 cells exposed to Erastin and melatonin or Fer-1 (n = 6). Differences were assessed using one-way ANOVA. The result represents the mean ± standard error of the mean. Values not sharing a common superscript letter differ significantly at p < 0.05; those with the same letter do not differ significantly (p ≥ 0.05). CON: control group, SD: sleep deprivation group, SD + L-Mel: SD + low melatonin (20 mg/kg) supplement group, SD + H-Mel: SD + high melatonin (40 mg/kg) supplement group.

