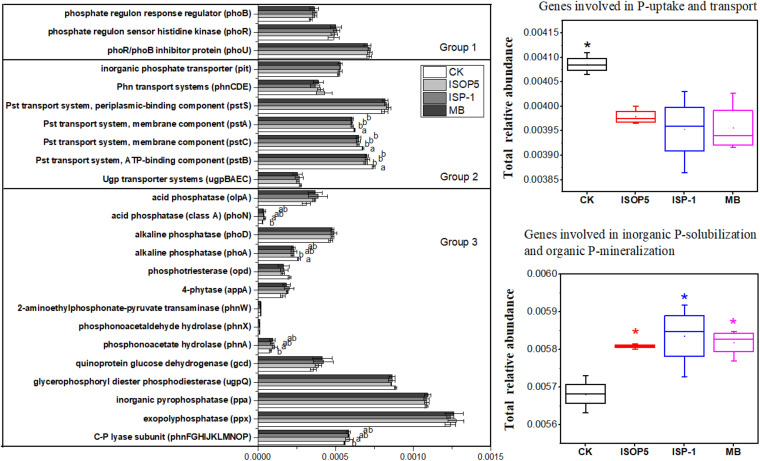
FIGURE 3.
Relative abundance in representative genes responsible for microbial (1) P starvation response regulation, (2) P uptake and transport, and (3) inorganic P solubilization and organic P mineralization in soils treated with or without bacterial inoculums. The relative abundances of genes were calculated based on the annotated reads. Group 1: Genes coding for P starvation response regulation; Group 2: Genes coding for P uptake and transport; Group 3: Genes coding for inorganic P solubilization and organic P mineralization. Different lowercase letters and asterisks represent the significant effects of bacteria inoculums on the relative abundance of genes involved in P transformation at p < 0.05. Error bars are ± standard error. CK: fertilized with basic fertilizer containing NPK fertilizers and composted cow manure; B. cepacia ISOP5: fertilized with basic fertilizer and then applied with suspension of strain B. cepacia ISOP5; R. palustris ISP-1: fertilized with basic fertilizer and then applied with suspension of strain R. palustris ISP-1; MB: fertilized with basic fertilizer and then applied with suspensions of B. cepacia ISOP5 and R. palustris ISP-1.

