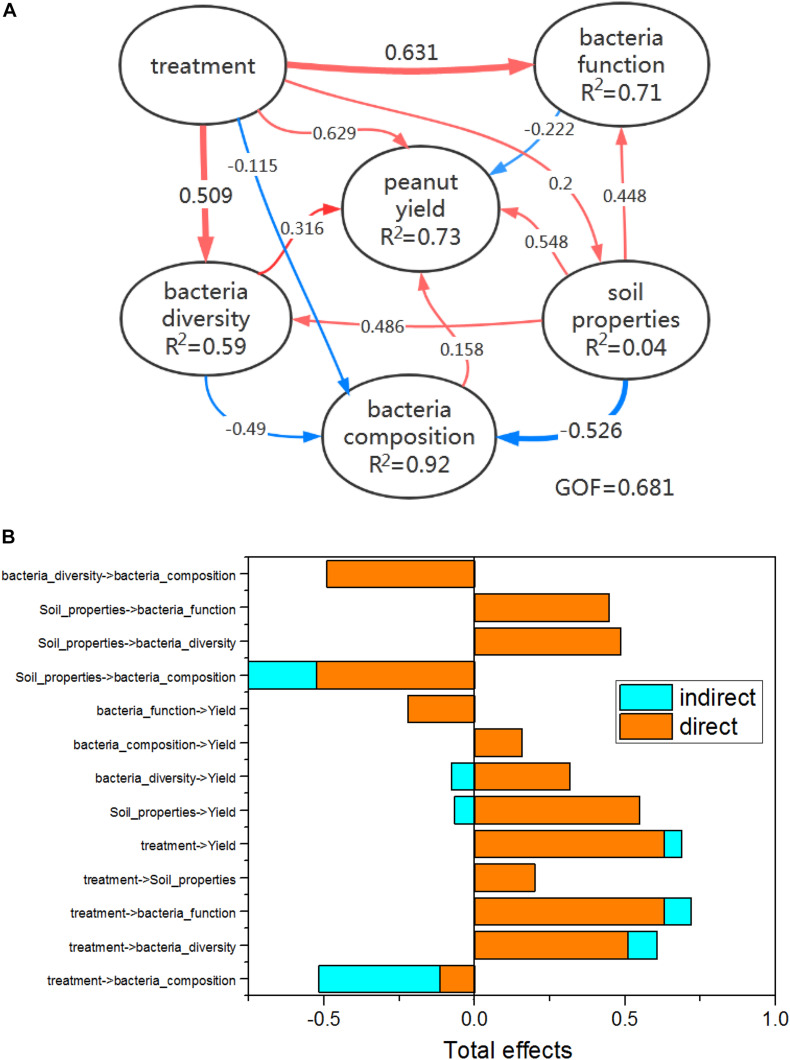
FIGURE 5.
(A) Direct and indirect effects of treatments, soil properties (pH, AP, OM, DTN, and TN), bacteria diversity, bacteria composition, and bacteria functions (abundance of genes involved in P and N metabolism) on peanut yield were shown using PLS-PM. Path coefficients (i.e., direct effects) are written on arrows, and significant coefficients are shown in bold (p < 0.05). Arrows with positive and negative coefficients are shown in red and blue, respectively. R2 values represent the variance of dependent variables explained by the inner model. GOF denotes the goodness of fit index. (B) Standardized total effects (i.e., direct plus indirect effects) were calculated using PLS-PM.

