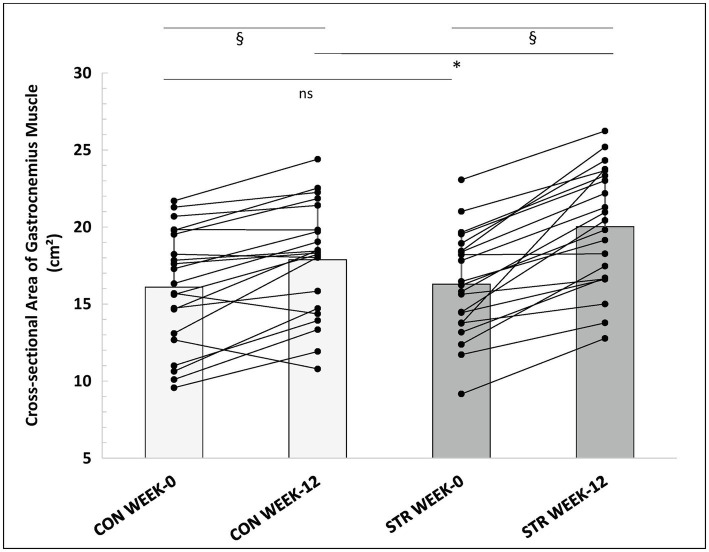
Figure 7.
Individualized values of gastrocnemius muscle anatomical CSA (sum of gastrocnemius medialis and lateralis) of the stretched and control legs, at week-0 and week-12. *: p < 0.01 from the corresponding control leg value; §: p < 0.05 from the corresponding pre-intervention value to post-intervention value; CON, control leg; STR, stretched leg.

