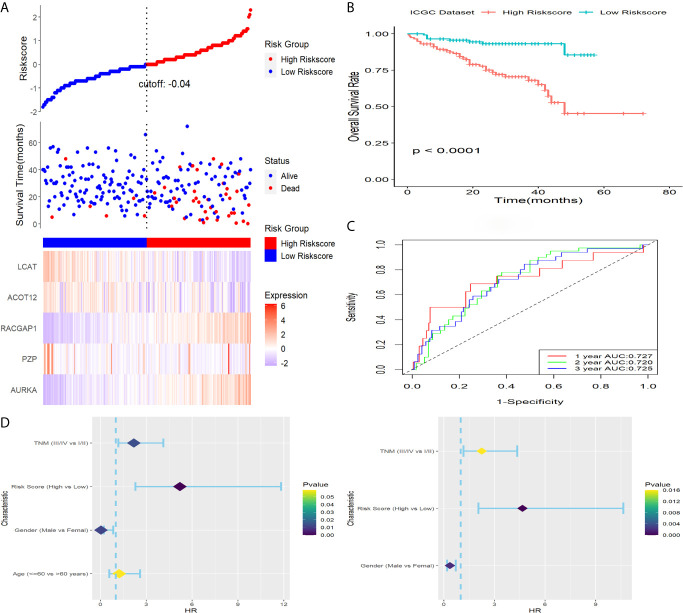
Figure 5.
Verification of this signature in ICGC. (A) Distribution of risk score, OS status as well as gene expression patterns. (B) Kaplan-Meier survival plot. (C) ROC analysis of the signature in predicting1, 2, 3 years OS rate. (D) Forest plot showed results of univariable (left) and multivariable (right) Cox analysis on OS rate.

