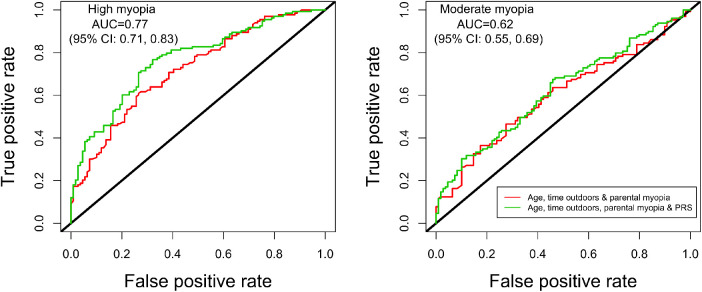
Figure 4.
Receiver Operating Characteristic (ROC) curve for detecting high myopia (≤ −5.00 D) and moderate myopia (≤ −3.00 D) versus no myopia controls using the polygenic risk score in SCORM. ROC curve for high myopia (≤ −5.00 D, n = 133) and moderate myopia (≤ −3.00 D, n = 129) versus no myopia controls (n = 109) with PRS, age, time outdoors, and parental myopia as predictors. The area under the curve (AUC) and 95% confidence interval corresponds to the PRS, age, time outdoors, and parental myopia model. The black line represents an AUC of 0.5.

