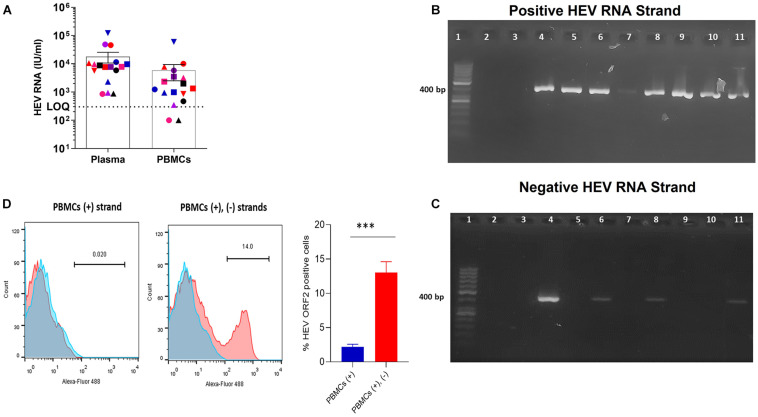
FIGURE 1.
Assessment of the viral load in PBMCs of AHE patients and detection of (+) and (–) RNA strands.(A) HEV RNA was quantified in the plasma and PBMCs from AHE patients (n = 17). Different colors and symbols represent different patients. The same color and symbol in the different groups (x-axis) indicate the same patient. LOQ: limit of quantification. (B,C) Representative gel showing the detection of strand-specific (+) HEV RNA strand (B) and (–) HEV RNA strand (C) in the PBMCs of AHE patients using strand-specific nested PCR targeting HEV ORF1. Lanes 6–11 (B,C) show strand-specific RT PCR for the following patients: pt#17 (lane 6), pt#12 (lane 7), pt#11 (lane 8), pt# 10 (lane 9), pt#9 (lane 10), pt#1 (lane 11). Lane 3 in (B,C) represents non-template control (negative controls for both assays). Lane (4) in (B,C) represents RNA extracted from primary human monocytes infected with HEV-1 in vitro, which is a positive control for both (+), and (–) HEV RNA strands using strand-specific primers for each strand. Lane (5) in (B,C) represents RNA extracted from the plasma of pt#17, which serves as a positive control for (+) RNA strand and negative control form (–) RNA strand. Lane 1 shows a 50-bp DNA ladder. Lane 2 in (B,C): left empty. (D) Representative gating showing the detection of the HEV ORF2 protein in the PBMCs of AHE patients. Blue histograms represent cells treated with the secondary A488 anti-mouse antibodies, and red histograms represent cells stained by the mouse anti-HEV-ORF2 followed by the secondary A488 anti-mouse antibodies. (Left) Expression of HEV ORF2 protein in the PBMCs with detectable (+) HEV RNA strand only (pt # 12). (Middle) Expression of HEV ORF2 protein in the PBMCs with detectable (+), (–) HEV RNA strands (pt # 1). (Right) Percentage of HEV ORF2 positive cells from PBMCs with detectable (+) HEV strand only (n = 10) and PBMCs with detectable (+), and (–) HEV RNA strands (n = 4). Error bar represents mean ± SEM, ***p < 0.001, as determined by the unpaired t-test.

