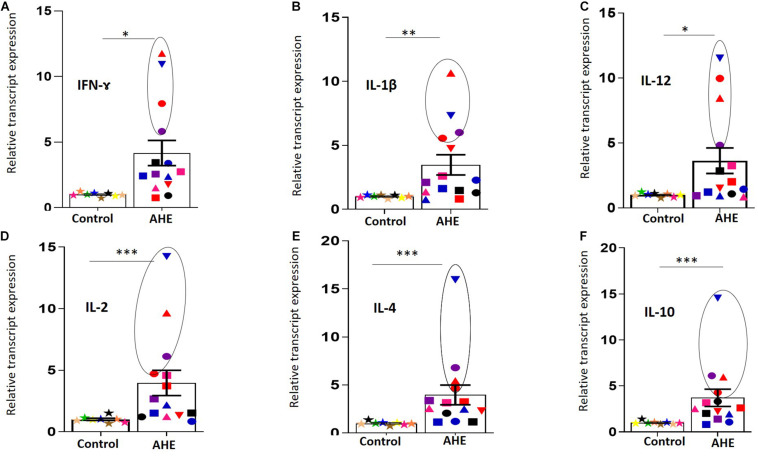
FIGURE 2.
Upregulation of the immune transcripts in the PBMCs of AHE patients.(A–F) PBMCs from AHE patients (n = 14) and healthy controls (n = 8) were assessed for the immune transcripts; IFN-Ɣ (A), IL-1β (B), IL-12 (C), IL-2 (D), IL4 (E), and IL-10 (F) by RT-qPCR. The transcript expression for each gene was normalized to the housekeeping gene. Different colors and symbols indicate different patients. Data represented as mean ± SEM. Circle is added around the PBMCs with detectable (+) and (–) RNA strands. *, **, *** indicate that p < 0.05, 0.01, and 0.001, respectively, as determined by Mann–Whitney test.

