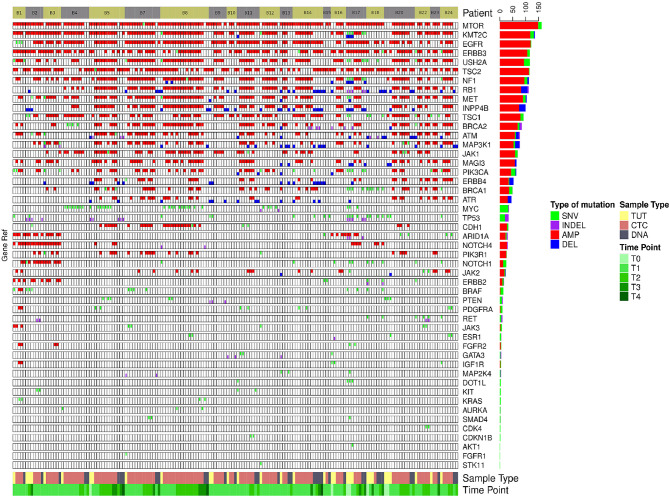
Figure 3.
The genomics alteration detected in the breast cancer samples. The rectangle panels and colors are as described in Figure 2 . In addition, the time point of the serially collected samples for selected patients are represented by the different tones of green color at the bottom panel from 1st (T1) up to 4th time point (T4) during the course of this study. T0 indicates the time point that the tumor was collected before this study.

