Figure 5.
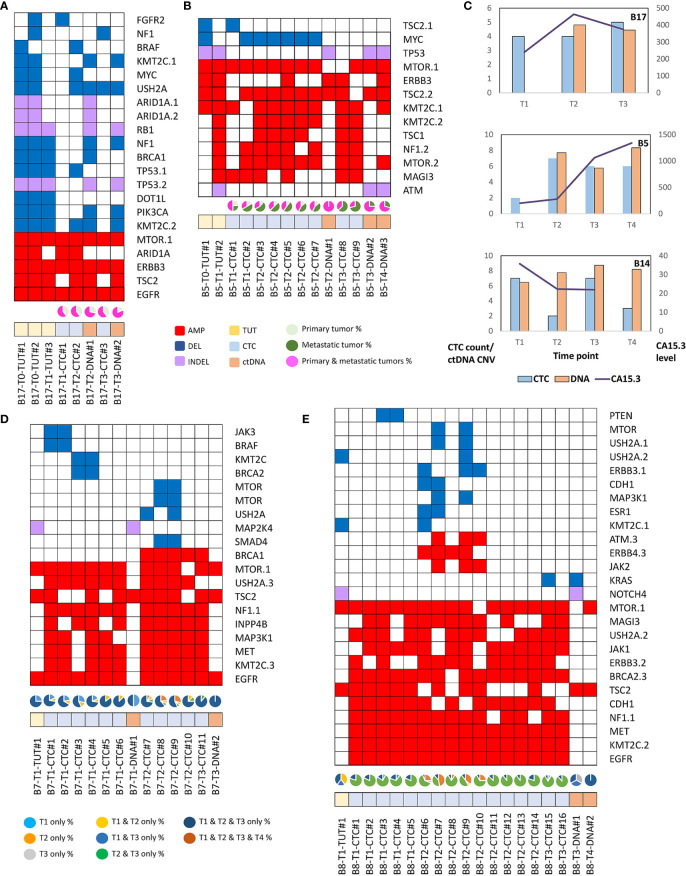
The mutation profiles and evolving genomics alteration in CTCs, ctDNA, primary and metastatic breast tumors. Red rectangles represent amplifications. Blue rectangles represent deletions. Green rectangles represent missense, Stopgain or Stoploss somatic SNVs. Purple rectangles represent somatic INDELs. TUT, CTC and DNA refers to tumors (yellow rectangles), individual CTC (blue rectangles) and ctDNA (orange rectangles) respectively. (A) Breast cancer patient, B17 with homogenous mutations profile in the primary (T0) and metastatic (T1) tumors. The pie chart represents the fraction of detected mutations to the primary tumor (light green) or metastatic (dark green) tumor or both tumors (pink). (B) Breast cancer patient, B5 with heterogenous mutations profile between primary and metastatic tumors. CTCs and ctDNA displayed better resemblance to metastatic than the primary tumors. (C) The CTC count, ctDNA CNV and CA15.3 level of serially collected samples for B5, B14 and B17 patients. (D) Majority of the mutations are consistently found at different time points in B7 breast cancer patient. However, selected mutations were only found in certain time points. The pie chart represents the fraction of detected mutations found at different time points. (E) Evolving genomics alterations during different course of treatment such as emergence of JAK2, ATM and KRAS mutations.

