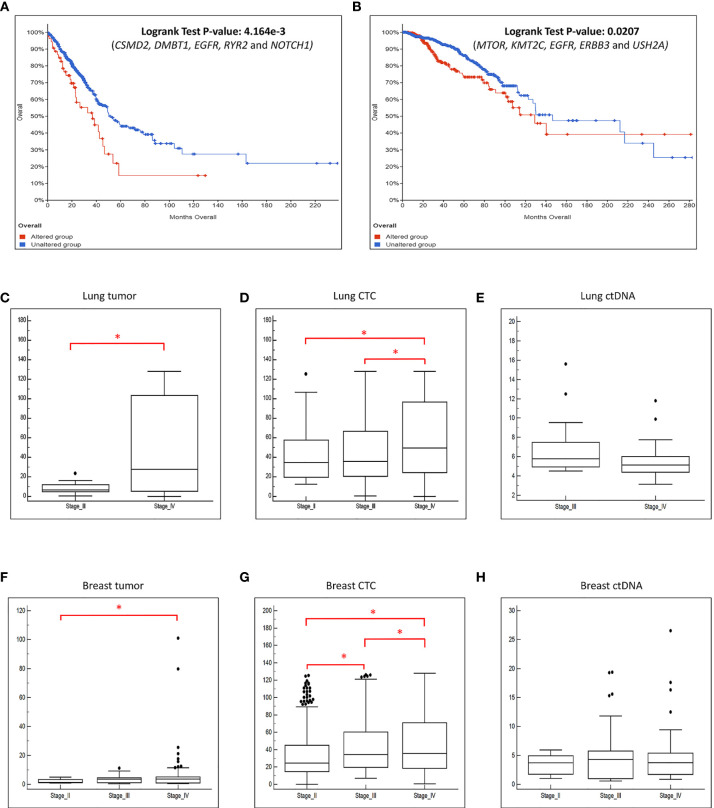
Figure 6.
The frequently altered genes found in this study are associated with worse survival outcome. We performed survival analysis using data obtained from cBioPortal with a large cohort of (A) lung and (B) breast cancer patients. X-axis represents time to event. Y-axis represents overall survival probability. The patients with mutated genes (red) have significantly poorer survival compared to patients without mutations (blue). The boxplot of the CNVs detected in the (C) tumor, (D) CTC and (E) ctDNA grouped by the disease stage for lung cancer patients. The boxplot of the CNVs detected in the (F) tumor, (G) CTC and (H) ctDNA grouped by the disease stage for breast cancer patients. There is significant increase of copy number changes (*p-value ≤ 0.05, t-test) when the disease progressed in the tumor and CTCs.

