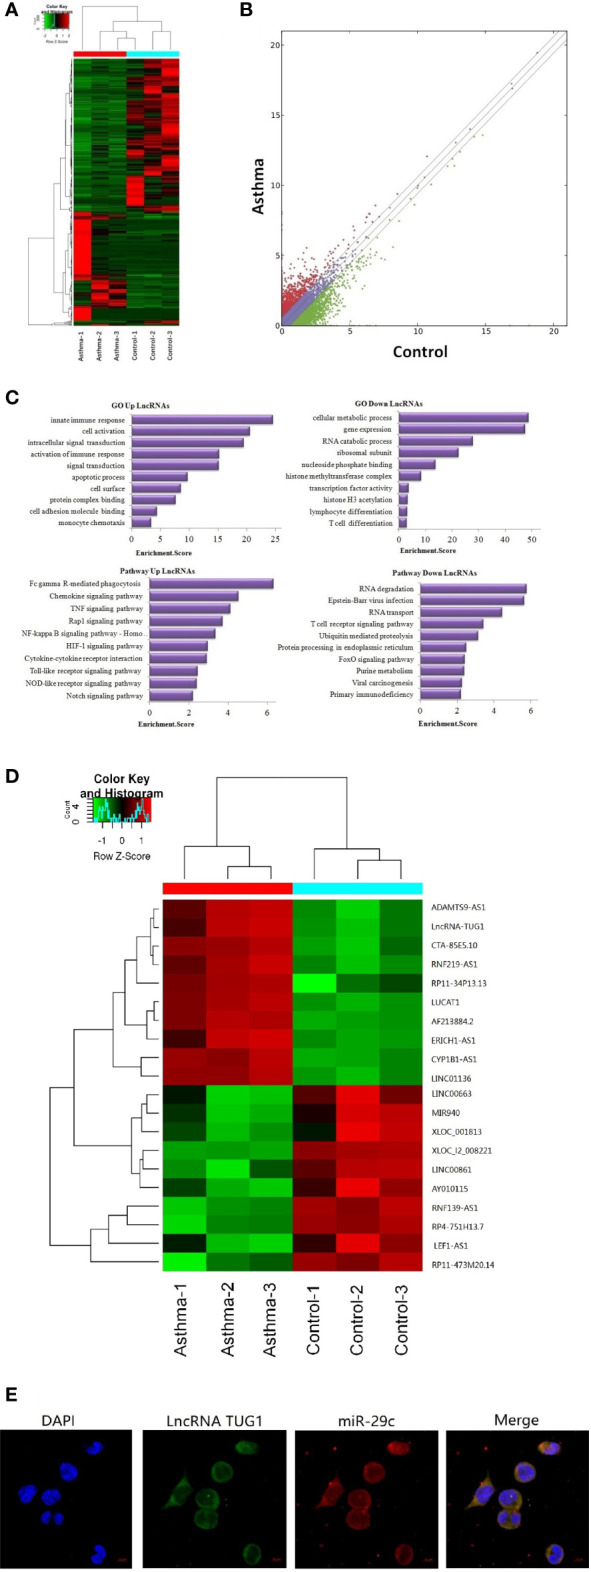
Figure 1.

Sequencing of lncRNAs in monocytes and co-location with miR-29c in macrophages. (A) The heat map depicts the hierarchical clustering of altered lncRNAs in monocytes between children with asthma exacerbation (n = 3) and the healthy control group (n = 3). (B) The scatter plot reveals that a significant difference existed in the distribution of lncRNAs between asthma exacerbation and the healthy control group. (C) GO and KEGG signaling pathways for lncRNAs that are differentially downregulated and target mRNAs. (D) The heat map depicts the hierarchical clustering of the top 10 up-regulated and down-regulated lncRNAs. (E) LncRNA TUG1 and miR-29c mainly distributed in the cytoplasm of macrophages using the FISH analysis from three independent experiments.
