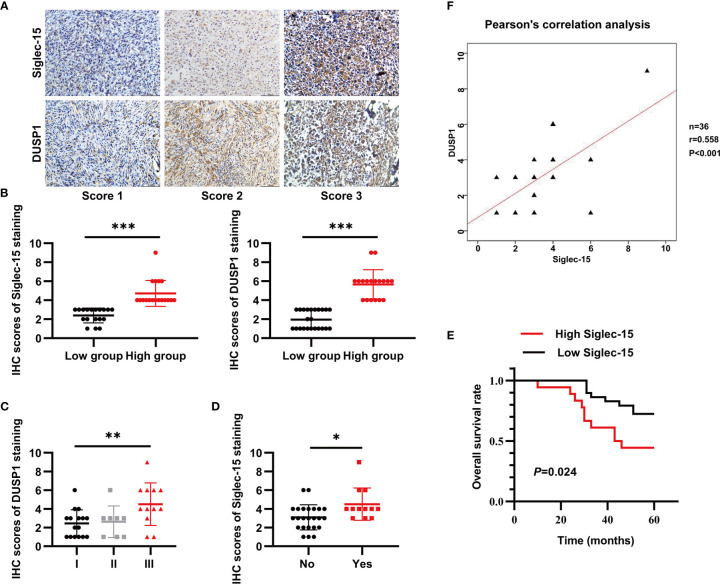
Figure 6.
Both Siglec-15 and DUSP1 are expressed in OS specimens. (A) Representative image of Siglec-15 protein and DUSP1 protein in OS tissue at different stages. (B) The IHC scores of Siglec-15 and DUSP1 protein in high expression group and low expression group. (C, D) The IHC scores of DUSP1 for the Enneking stage and the IHC scores of Siglec-15 for lung metastasis. (E) Kaplan-Meier analysis between low Siglec-15 expression group and high Siglec-15 expression group. (F) The correlation between Siglec-15 expression and DUSP1 expression by the Pearson’s correlation analysis. *P < 0.05, **P < 0.01 and ***P < 0.001. Scale bars, 100 µm, in the lower right of photos.

