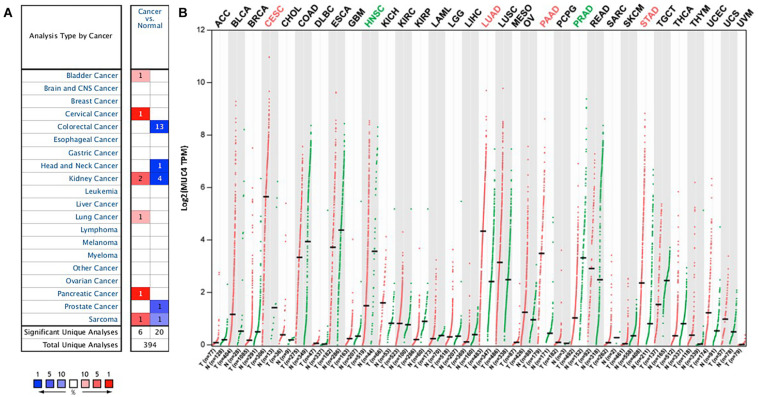
FIGURE 1.
MUC4 mRNA expression levels in pan-cancer. (A) Upregulated or downregulated expression of MUC4 in tumor tissues, compared with normal tissues of each cancer type in Oncomine. Red signifies the gene’s overexpression in the analyses represented by that cell in the table; blue represents the gene’s underexpression in those analyses. Intensity of color signifies the best rank of that gene in those analyses. The number in each cell represents the number of analyses that meet your thresholds within those analyses and cancer types. (B) MUC4 expression profile across all tumor samples and paired normal tissues in GEPIA2. Each dot represents a distinct tumor or normal sample.

