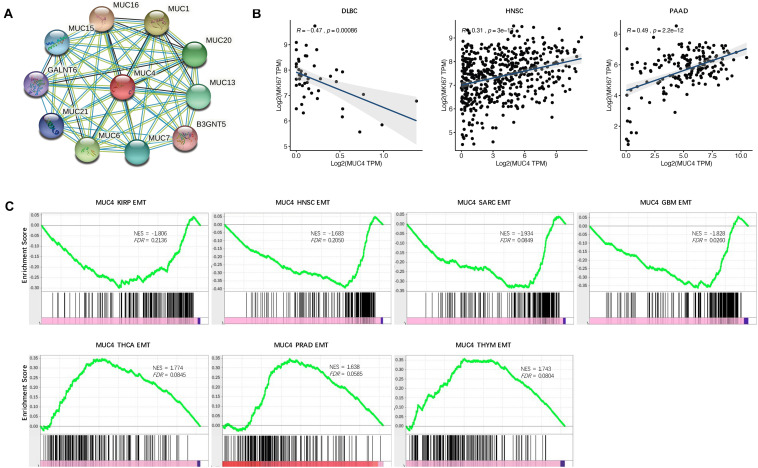
FIGURE 4.
Functional effects of MUC4. (A) PPI network. Network nodes represent proteins and edges represent protein–protein associations, including both functional and physical protein associations. Line thickness indicates the strength of data support. (B) Correlation of MUC4 with proliferation in CVCDAP. (C) Enrichment of MUC4 in EMT in CVCDAP. Values of NES denote positive and negative enrichment. EMT, epithelial–mesenchymal transition.

