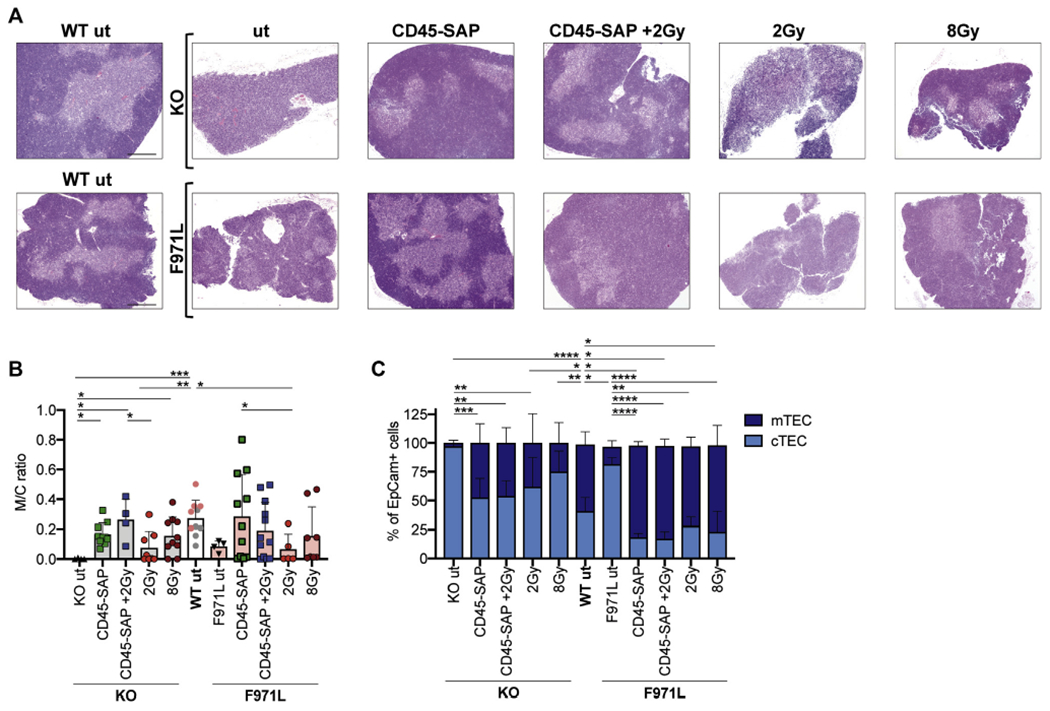
FIG 4.

TEC reconstitution in conditioned Rag1mut mice. A, Representative images of thymic sections stained with hematoxylin and eosin (4x objective and 500-μm scale bar). B, Medullary (M) and cortical (C) areas were measured on thymic sections stained with hematoxylin and eosin and shown as a ratio. Gray dots in the WT bar are values from the SR-Tiget laboratory, and pink dots are values from the from the NIH laboratory; 1-way ANOVA, Kruskal-Wallis test for multiple comparison. C, TEC reconstitution was measured as the proportion of mTECs (EpCam+ Ly51+ UEA1high/CD80high) and cortical TECs (EpCam+ Ly51+ UEA1low/CD80low) were measured by flow cytometry 16 weeks after the transplant in Rag1-KO (knockout [KO] and Rag1-F971L [F971L] mice. One-way ANOVA, Kruskal-Wallis test for multiple comparison was applied on mTEC frequencies. *P < .05; **P < .005; ***P < .0005; ****P < .0001. Means ± SDs are shown.
