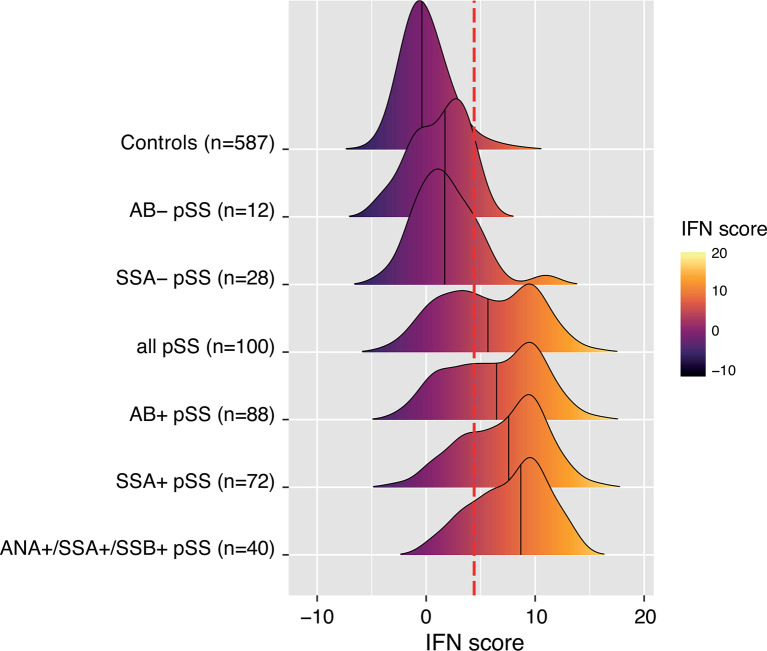
Figure 2.
Ridges plot representing the distribution DNAm-based IFN scores in controls and subgroups of patients with pSS from the discovery cohort defined by autoantibody status. An individual patient can be part of one or several pSS subgroups. Ridges are sorted by increasing group median indicated by the black vertical line within each ridge. Ridges gradient indicates low (dark purple) to high (light yellow) DNAm IFN score levels. The dotted red vertical line indicates the threshold for high IFN score (DNAm IFN score > 4.4 corresponding to > mean IFN scorectrl +2s.d.ctrl).

