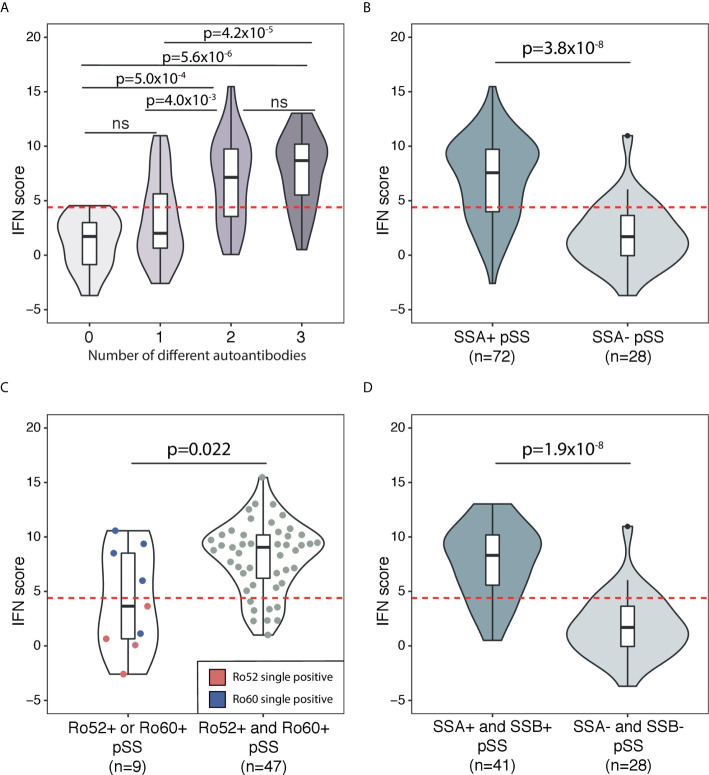
Figure 3.
Association between DNAm IFN score levels and different autoantibody profiles in patients with pSS in the discovery cohort. The threshold for high IFN score is indicated by the dotted red horizontal line in each graph. Boxes within the violins indicate median and interquartile range, whiskers indicate total range. (A) Association between DNAm IFN score and number of different autoantibodies in sera from patients with pSS. Autoantibodies included in the analysis were ANA, SSA and SSB. (B) IFN score in SSA positive pSS compared with SSA negative pSS. (C) SSA positive pSS patients stratified for Ro52 or Ro60 single positivity (violin on the left with IFN scores of Ro52 single positive pSS indicated by red dots and Ro60 single positive pSS indicated by blue dots) compared with Ro52 and Ro60 double positive pSS (violin on the right with individual IFN scores of patients indicated by grey dots). (D) IFN score in SSA and SSB double positive pSS compared with SSA and SSB double negative pSS. (A) Kruskal-Wallis with post hoc Mann-Whitney U. (B–D) Mann-Whitney U.

