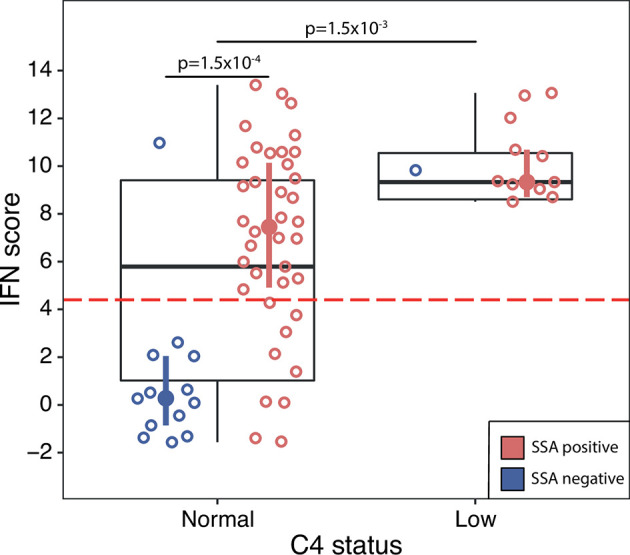
Figure 4.

DNAm IFN score levels in pSS patients with normal C4 status (left box) compared with pSS patients with low C4 status (right box), discovery and replication cohort together. Dotted red horizontal line indicates threshold for high IFN score. Boxes represent median and interquartile range, whiskers indicate total range. Patients positive for SSA antibodies are indicated by red open circles, patients negative for SSA antibodies by blue open circles. IFN score median and interquartile range for pSS patients stratified on SSA status are indicated by red (SSA positive pSS) and blue (SSA negative pSS) filled circles and vertical lines, respectively. Differences between groups were assessed using Mann-Whitney U.
