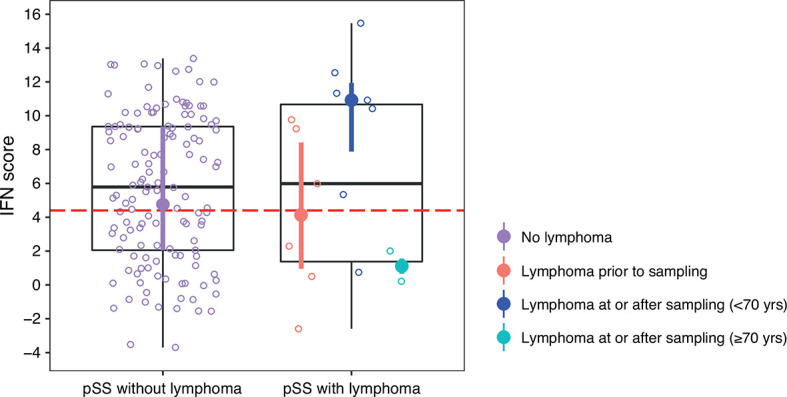
Figure 5.

DNAm IFN score levels in patients with pSS stratified for lymphoma, discovery and replication cohort together. Dotted red horizontal line indicates threshold for high IFN score. Boxes represent median and interquartile range, whiskers indicate total range. pSS patients without lymphoma indicated in purple in the left panel. In the right panel pSS patients with lymphoma stratified for lymphoma prior to DNA sampling (in red), lymphoma at or after DNA sampling in patients < 70 years of age at lymphoma diagnosis (in dark blue), and lymphoma at or after DNA sampling in patients ≥ 70 years of age at lymphoma diagnosis (in light blue). DNAm IFN score median and interquartile range for each of the pSS subgroups are indicated by filled circles and vertical lines colored according to the corresponding patient subgroup.
