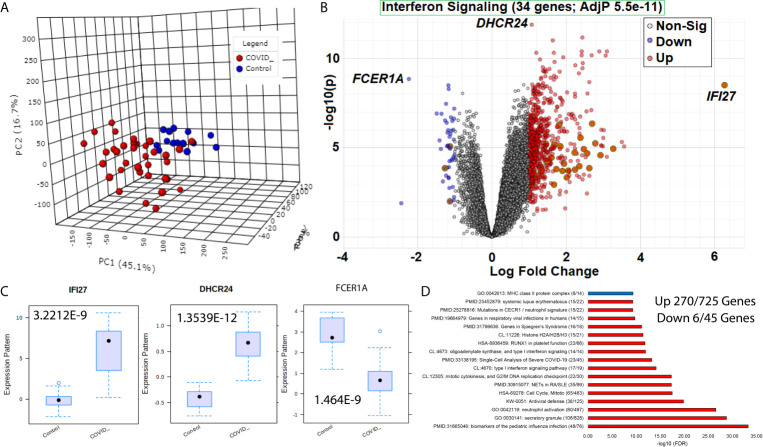
Figure 2.
Blood transcriptome gene signatures of SARS-CoV-2 patients. (A) Three dimensions of principal components (PC1-PC3) of first collection time point RNAseq gene annotations for samples of COVID-19 (red) or control (blue) patients. (B) Volcano plot of gene expression in COVID-19 or control patients with significant genes higher (red) or lower (blue) marked. The x-axis shows the log2 fold change, and the y-axis shows the -log10 of the adjusted p-value. Shadowed genes are involved in interferon signaling. (C) Box and whisker plot of the top three genes labeled in panel (B, D) Top gene ontology (GO) enrichment terms for up (red) or down (blue) genes. The term for each enriched description is shown first, followed by the name, and then in parentheses, the number of genes is significant relative to the number of genes within the genome annotated for the term. The x-axis shows the -log10 of the false discovery rate (FDR).

