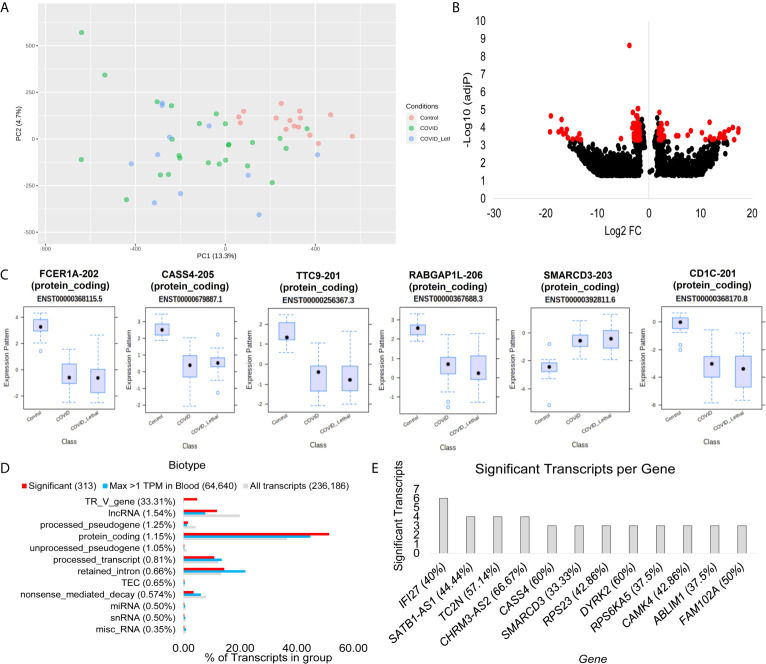
Figure 3.
Blood transcriptome transcript isoform signatures of SARS-CoV-2 patients. (A) Two dimensions of principal components (PC1-PC2) of first collection time point RNAseq transcript annotations for samples of control (red), COVID-19 and survived (green), or COVID-19 and lethal (blue). (B) Volcano plot of transcript expression in COVID-19 or control patients with significant genes with a Log2 of 2 and adjP <0.0005 marked in red. The x-axis shows the log2 fold change, and the y-axis shows the -log10 of the adjusted p-value. (C) Box and whisker plot of the top six transcripts, with each having the transcript identifier, biotype, and Ensembl transcript ID listed. (D) Top biotypes enriched in the significant transcripts for COVID-19, with the percent listed in paratheses for each biotype annotation. The top biotypes are listed based on enrichment of significance annotation (red) relative to detection within blood within at least one sample with >1TPM (cyan). The percent of transcripts for the entire Gencode 38 database of 236,186 known transcripts is shown in gray. (E) The number of transcripts significantly different in the COVID-19 group relative to controls for each gene. The percent of transcripts identified significant relative to all known transcripts for each gene is shown in paratheses.

