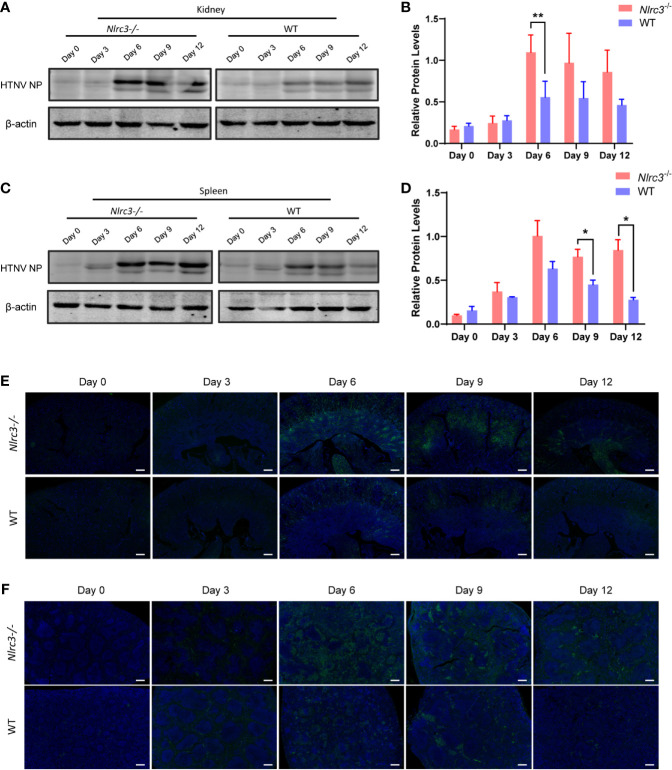
Figure 2.
Expression levels of HTNV nucleoprotein (NP) in spleen and kidney samples obtained from Nlrc3−/− and WT mice after viral challenge. Samples were collected on 3, 6, 9, and 12 dpi for Western blot and immunohistochemistry (IHC) analysis. (A) Western blot results of the kidneys of Nlrc3−/− and WT mice. Lanes represent corresponding time points. (B) Densitometric analysis of band intensity for A (Nlrc3−/− mice, n=15; WT mice, n=10). (C) Western blot results of the spleens. (D) Densitometric analysis of band intensity for C (Nlrc3−/− mice, n=25; WT mice, n=20). IHC staining of mouse kidney (E) and spleen sections (F) to detect HTNV nucleocapsid protein in Nlrc3−/− (top) and WT mice (bottom) after infection. HTNV NP (green), and DAPI (blue). IHC images are representative of at least three samples. Scale bars, 50 μm. *p < 0.05; **p < 0.01.

