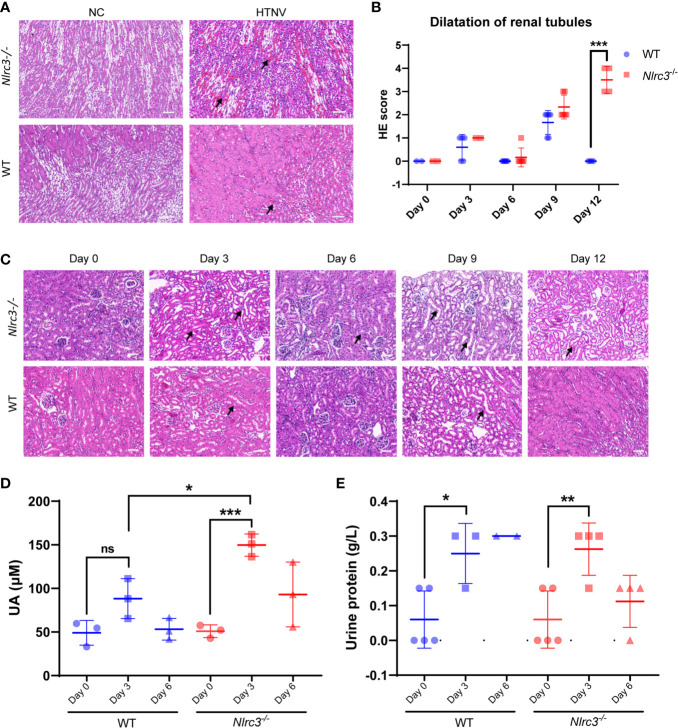
Figure 4.
Renal pathological changes in HTNV-infected mice. (A) The kidney was collected on 3, 6, 9, and 12 dpi and fixed in 4% paraformaldehyde, succumbed to H&E staining. Pathological analysis showing focal hemorrhage (black arrow) in the renal medulla of HTNV-infected mice on 6 days post-inoculation. (B) Statistical figure based on histological scores of dilations of renal tubules for Nlrc3−/− mice (n=6) and WT mice (n=6). (C) Pathological analysis showing extended renal tubules (black arrow) in mice after HTNV infection. H&E images are representative of at least three samples. Scale bars, 50 μm. (D) The whole blood was centrifuged at 1,500 g for 10 mins at room temperature to obtain serum for biochemical detection. The levels of uric acid (UA) in the serum (μM) of Nlrc3−/− mice (n=3) and WT mice (n=3). (E) Urine test of Nlrc3−/− and WT mice post-infection. Urine was collected on days 0 (n=5 in both groups), 3 (Nlrc3−/− mice: n=4; WT mice: n=3), and 6 post-infection (Nlrc3−/− mice: n=4; WT mice: n=2) for urine routine examination. The level of urine protein of infected mice was quantified. Bars are means ± SD. *p < 0.05; **p < 0.01; ***p < 0.001; ns is short for no significance.

