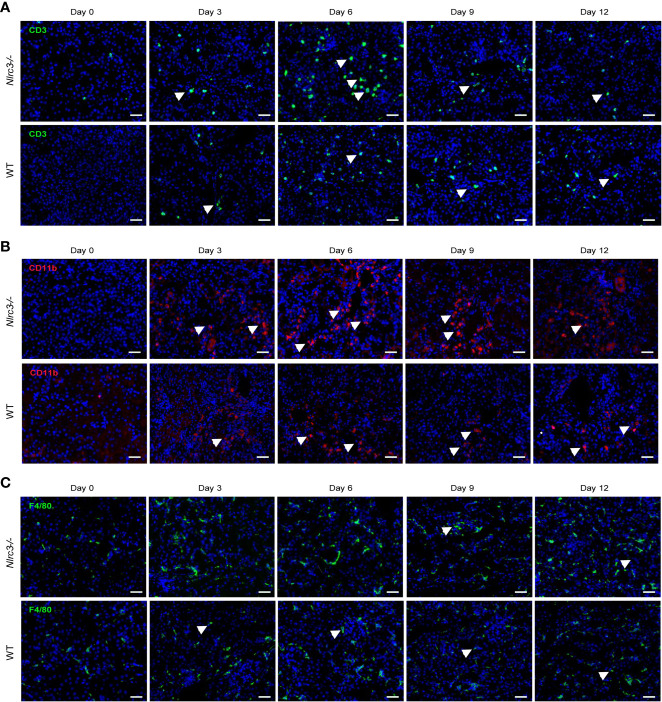
Figure 5.
IHC staining for inflammatory cell infiltration in the kidney of HTNV infected mice. (A) A representative image of IHC assay and CD3 was used to detect the infiltration of inflammatory T cells. The upper panel shows the kidney of Nlrc3−/− mice; the lower panel shows the kidney of WT mice. Green signals represent CD3, and blue indicates cell nucleus. (B) Representative image of IHC staining for CD11b of the kidney of HTNV infected mice. CD11b was used to detect myeloid cells, and Upper panel shows the kidney of Nlrc3−/− mice; the lower panel shows the kidney of WT mice. Red signals represent CD11b; Blue signals represent DAPI. (C) Representative image of IHC staining for F4/80 of the kidney of HTNV infected mice. F4/80 was used to detect macrophages. The upper panel shows the kidney of Nlrc3−/− mice; the lower panel shows the kidney of WT mice. Green signals represent F4/80; Blue signals represent DAPI. IHC images are representative of at least three samples. Scale bars, 50 μm.

