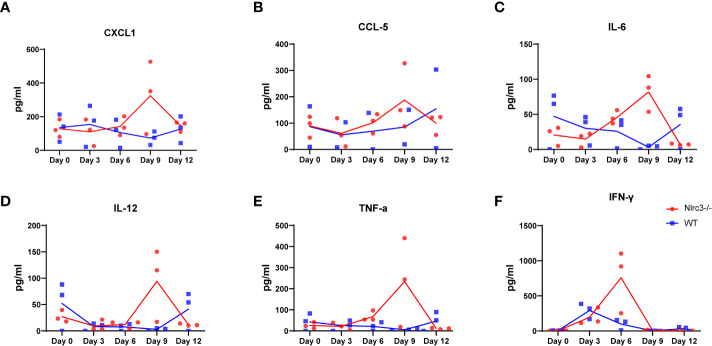
Figure 6.
Inflammatory Response in HTNV-infected Mice. The serum of each mice was collected on 3, 6, 9, and 12 dpi for cytokine measurement. The levels of CXCL1 (A), CCL5 (B), IL-6 (C), IL-12 (D), TNF-α (E) IFN-γ (F) in serum of HTNV-infected mice (pg/mL). Red dots and lines represent Nlrc3−/− mice, and blue indicate WT mice. Bars are means ± SD. Nlrc3−/− mice, n=3; WT mice, n=3.

