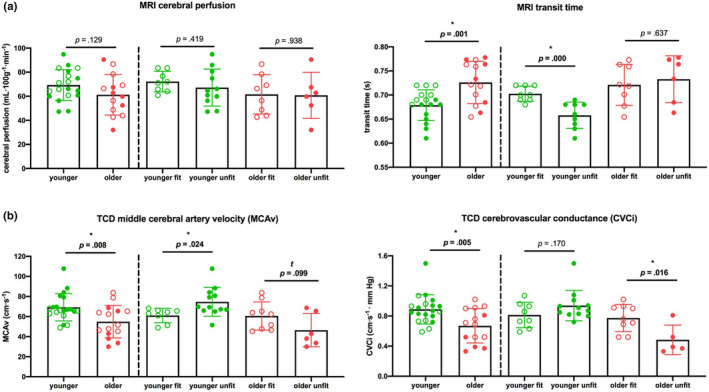
FIGURE 1.

Graphs show mean and individual participant points for resting CBF measures obtained from (a) MRI data (gray matter cerebral perfusion and transit times; see Figure S1.B for gray matter mask) and (b)TCD data (MCAv and CVCi), summarizing results from Table 2. Significance tested with one‐way ANOVAs: *Represents significant effect: p ≤.05, t Shows a trend toward significance: 0.05 < p ≤0.10. Error bars show standard deviation. Abbreviations: CVCi, cerebrovascular conductance; MCAv, middle cerebral artery blood velocity; MRI, Magnetic Resonance Imaging; TCD, transcranial Doppler
