
FIGURE 5.
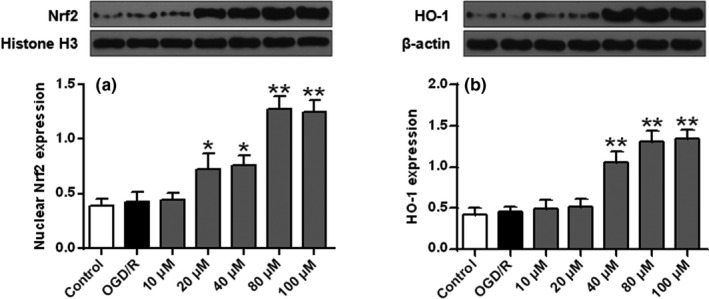
ISO’s effects on protein expression of Nrf2 (a) and HO‐1 (b) in SH‐SY5Y cells. n = 6. * p < .05 and **p < .01 versus the OGD/R group
Official websites use .gov
A
.gov website belongs to an official
government organization in the United States.
Secure .gov websites use HTTPS
A lock (
) or https:// means you've safely
connected to the .gov website. Share sensitive
information only on official, secure websites.
ISO’s effects on protein expression of Nrf2 (a) and HO‐1 (b) in SH‐SY5Y cells. n = 6. * p < .05 and **p < .01 versus the OGD/R group