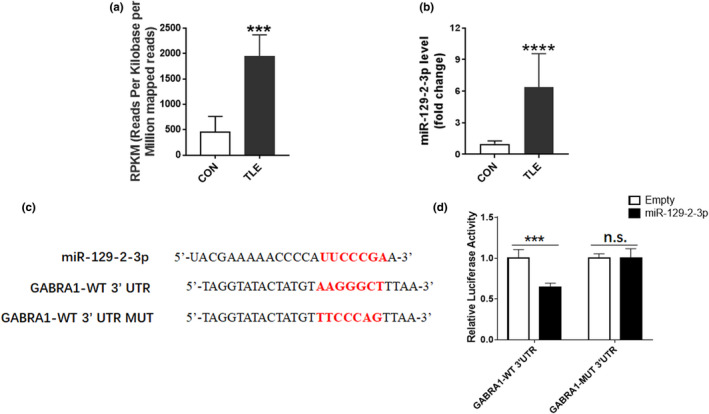
FIGURE 1.

Direct target of GABRA1 by miR‐129–2‐3p (a) Quantitative measurement of miR‐129–2‐3p as assessed by RNA microarray analysis (***p <.001 compared to control group, n = 3 per group). (b) qPCR analysis showing the induction of miR‐129–2‐3p in refractory TLE patients (****p <.0001 compared to control group, n = 9 in control group and n = 11 in TLE group). (c) Sequences of miR‐129–2‐3p and predicted target of miR‐129–2‐3p on GABRA1 3’UTR. (d) Measured luciferase activity showing the inhibitory effect on GABRA1 3’UTR (***p <.001 compared to empty pGL3‐basic luciferase vector, n = 5–6 per group)
