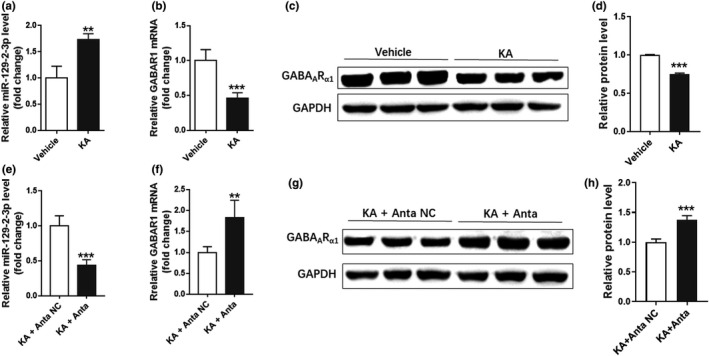
FIGURE 3.

miR‐129–2‐3p was increased in KA‐treated primary hippocampal neurons. (a‐b). qPCR analysis indicating miR‐129–2‐3p (a) and GABRA1 (b) level after KA treatment in primary hippocampal neurons (**p <.01, ***p <.001 compared to the vehicle group, n = 3–4). (c‐d) Western blot analysis demonstrating the GABAARα1 protein level after KA treatment (***p <.001 compared to the Vehicle group, n = 3). (e‐f) qPCR analysis indicating miR‐129–2‐3p (e) and GABRA1 (f) level after treatment of Anta‐129 together with KA (**p <.01, ***p <.001 compared to the vehicle group, n = 3–4). (g‐h) Western blot analysis demonstrating the GABAARα1 protein level after treatment of Anta‐129 together with KA (***p <.001 compared to the KA+Anta NC group, n = 3)
