
FIGURE 5.
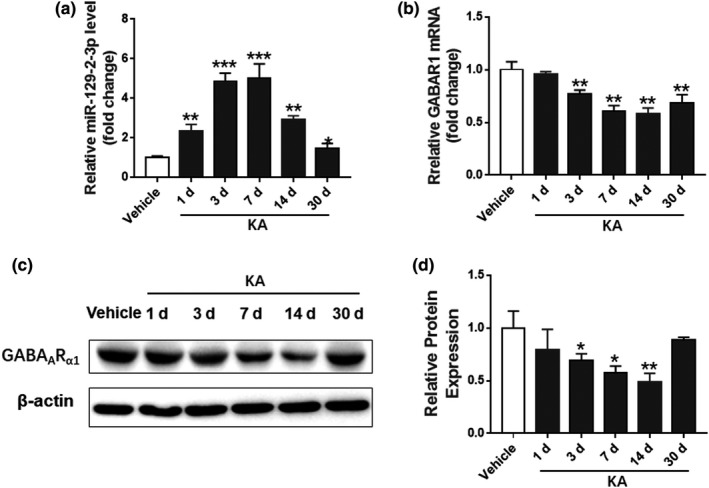
Regulation of miR‐129–2‐3p and GABRA1 in KA‐induced seizure model. (a‐b) qPCR analysis showing the miR‐129–2‐3p (a) and GABRA1 (b) level at different time points in KA‐induced seizure model (**p <.01, ***p <.001 compared to the vehicle group, n = 3–4). (c‐d) Western blot analysis demonstrating the GABAARα1 protein level at different time points in KA‐induced seizure model (*p <.05, **p <.01 compared to the vehicle group, n = 3–4)