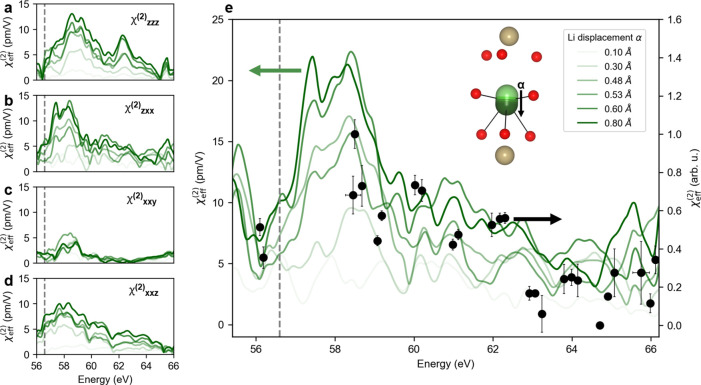
Figure 2.
The energy-dependent nonlinear susceptibility across the Li K-edge. (a–d) χzzz(2), χzxx, χxxy(2), and χxxz across the Li K-edge. (e) The experimentally determined nonlinear susceptibility shown (black points) overlaid onto the calculated χeff(2)(2ω). For panels (a-e), the dashed gray line at 56.6 eV corresponds to the onset of the Li K edge: darker green corresponds to larger Li displacement along the polar axis (α) of the LiOsO3 polar phase as indicated by the inset in panel (e) and in the corresponding legend. Vertical error bars correspond to errors in the quadratic fit of eq 1, whereas horizontal error bars are a result of energy jitter of the FEL.

