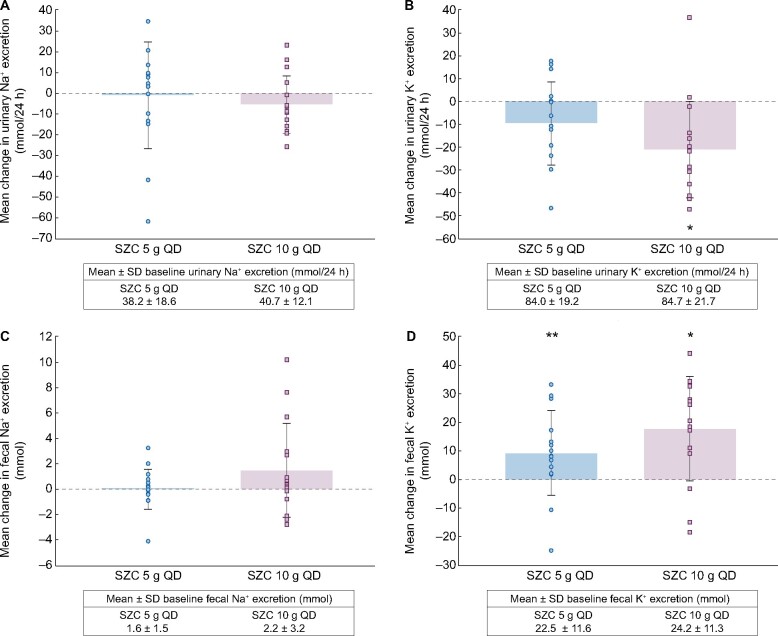
FIGURE 3:
Mean change from baseline (Days 3–4) to treatment period (Days 7–8) in (A) urinary sodium excretion, (B) urinary potassium excretion, (C) fecal sodium excretion and (D) fecal potassium excretion with SZC 5 or 10 g QD. Error bars are the SD. Circles and squares show values for individual participants in the SZC 5 g and SZC 10 g groups, respectively. *P < 0.01 versus baseline. **P < 0.05 versus baseline.

