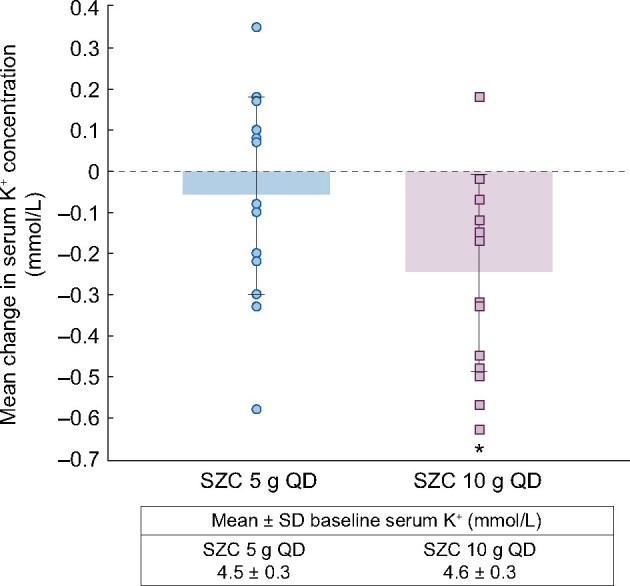
FIGURE 4:

Mean change from baseline (Days 3–4) to treatment period (Days 7–8) in serum potassium concentration with SZC 5 or 10 g QD. Error bars are the SD. Circles and squares show values for individual participants in the SZC 5 g and SZC 10 g groups, respectively. *P < 0.01 versus baseline.
