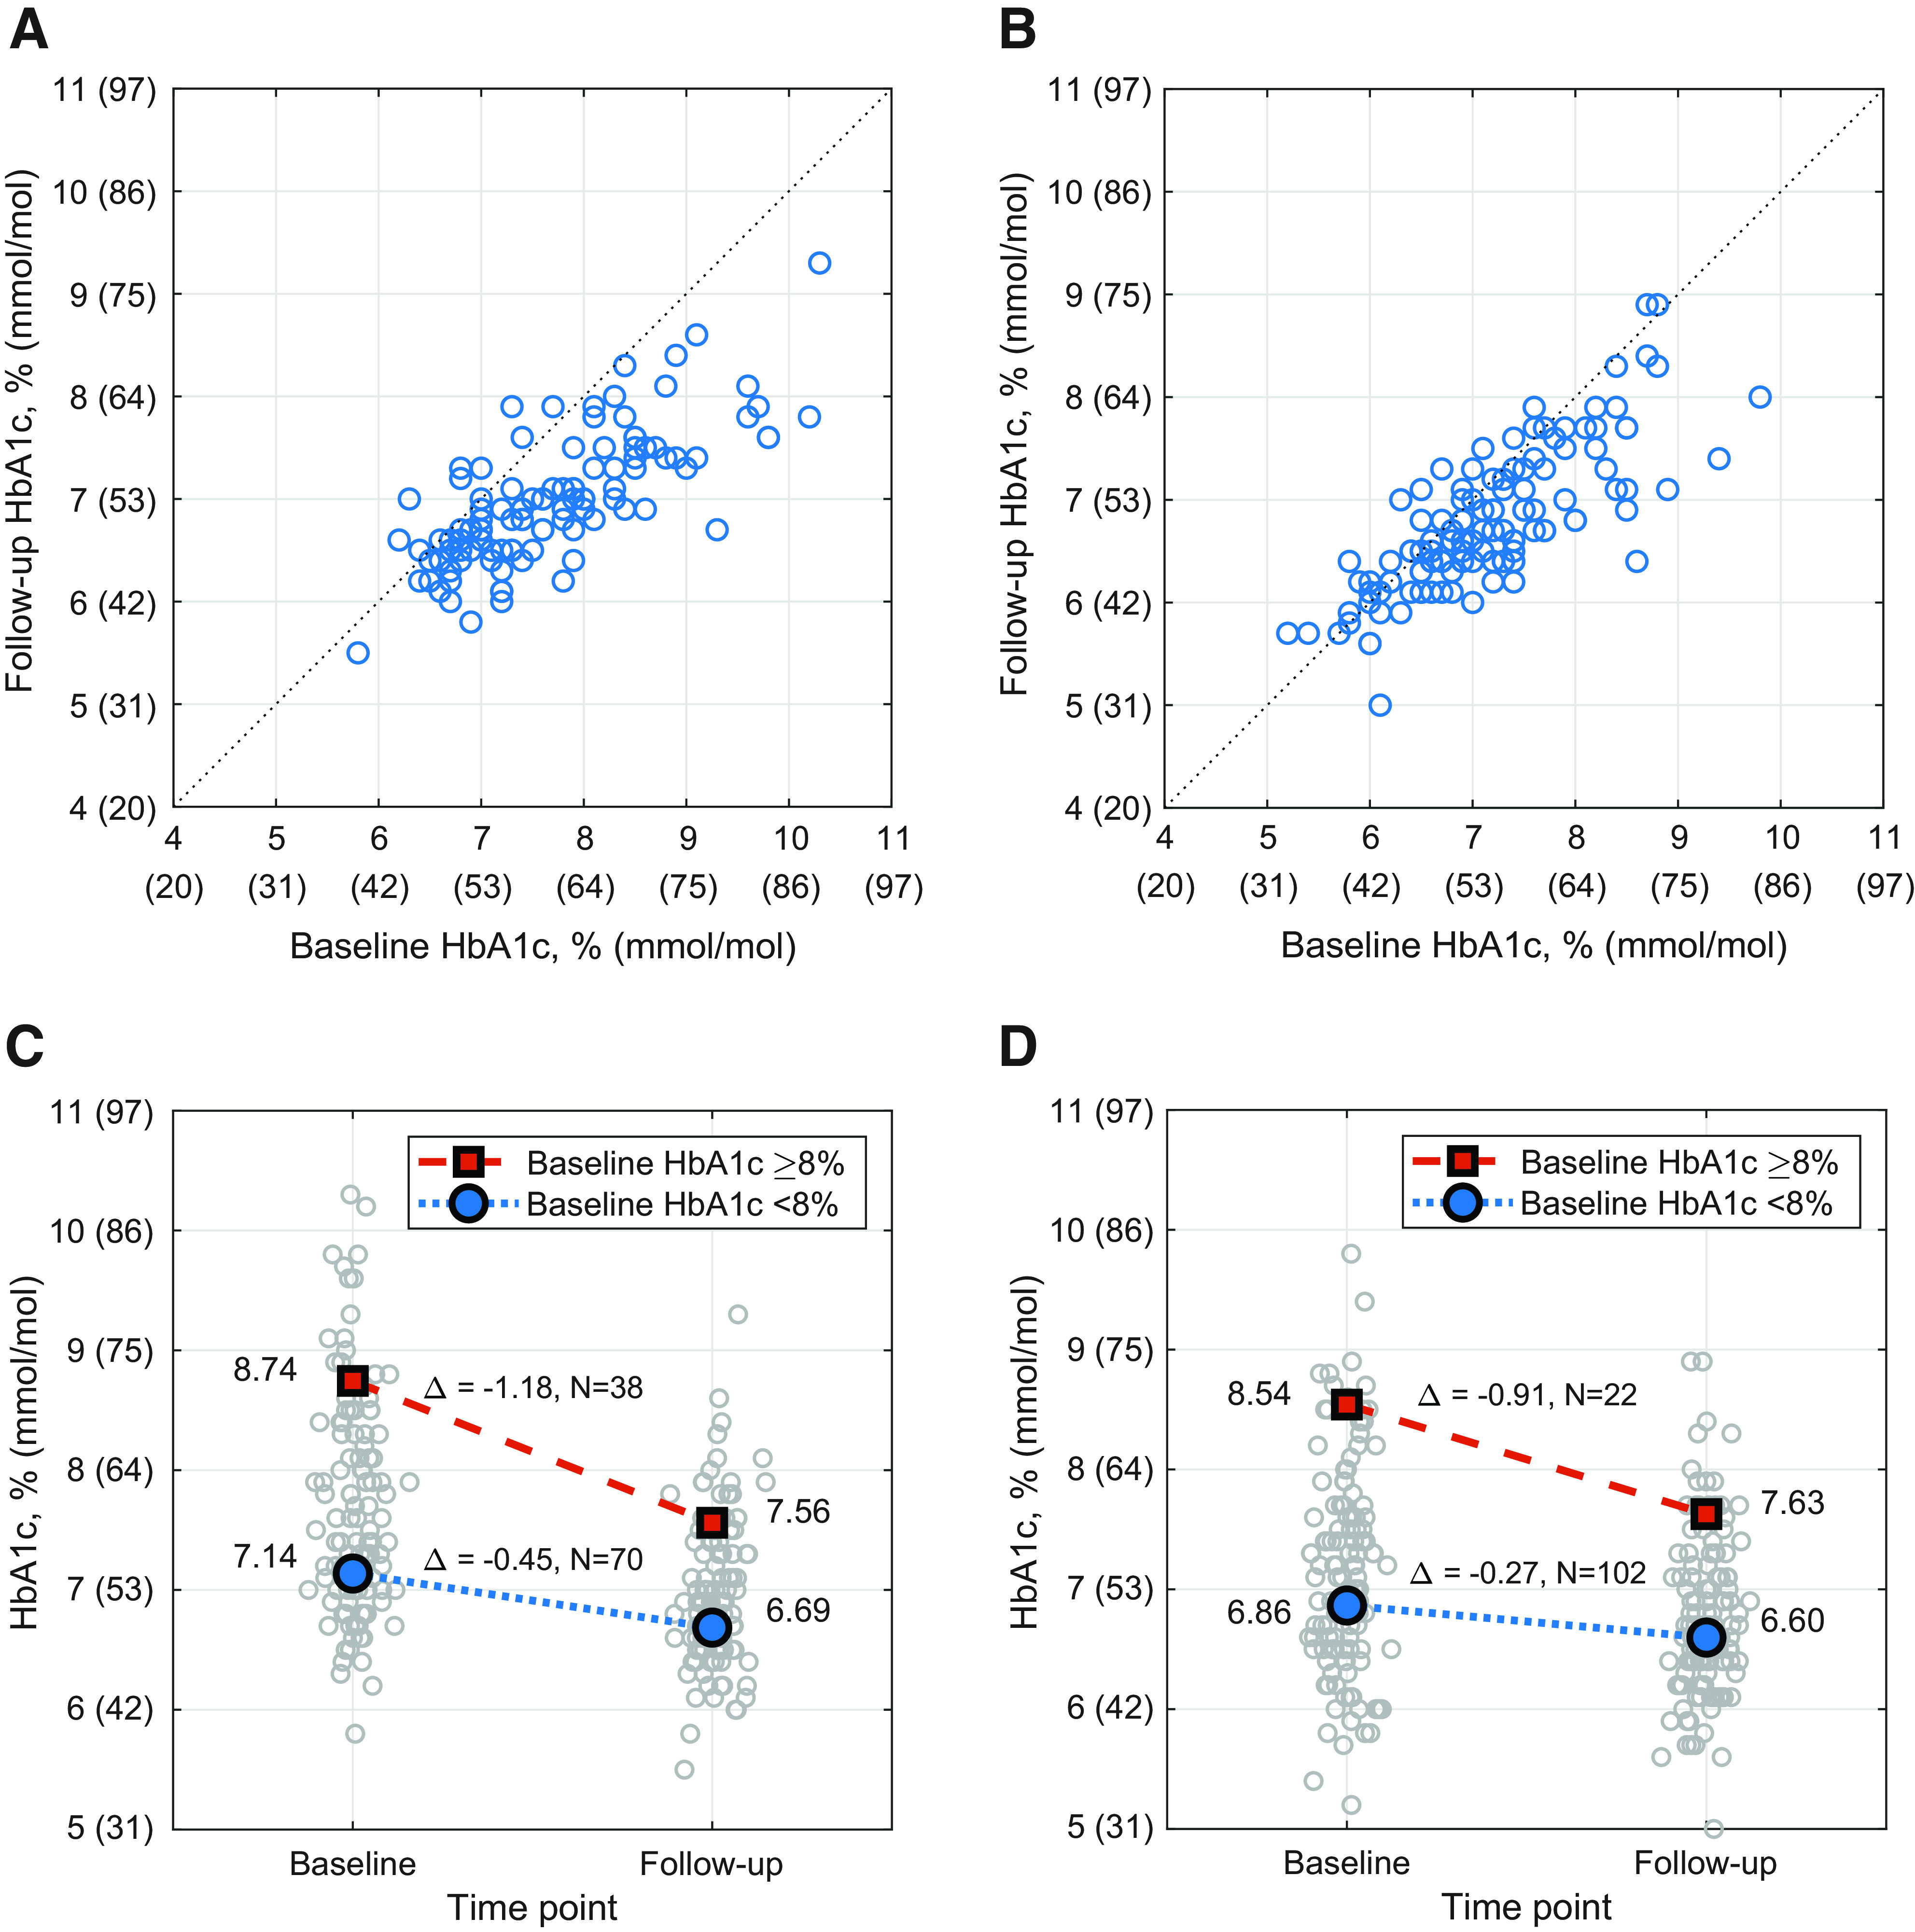
Figure 1.

Changes in HbA1c. Individual participant HbA1c results are shown before (baseline) and after (follow-up) the 3-month automated insulin delivery phase for all participants with measurements available at both time points. HbA1c at follow-up plotted vs. HbA1c at baseline for children age 6–13.9 years (n = 108) (A) and adults age 14–70 years (n = 124) (B), with each circle representing a single participant. Mean HbA1c (%) values at baseline and follow-up when stratified into two groups by baseline HbA1c <8% (blue circle) and ≥8% (red square) for children (n = 108) (C) and adults (n = 124) (D), with the distribution of individual participant results at each time point shown as gray circles. Mean HbA1c (mmol/mol) values for children (C) with baseline HbA1c <64 mmol/mol (blue circle) and ≥64 mmol/mol (red square) are 55 and 72 mmol/mol at baseline and 50 and 59 mmol/mol at follow-up (change −4.9 and −12.9 mmol/mol), respectively. HbA1c values for adults (D) with baseline HbA1c <64 mmol/mol (blue circle) and ≥64 mmol/mol (red square) are 51 and 70 mmol/mol at baseline and 49 and 60 mmol/mol at follow-up (change −3.0 and −9.9 mmol/mol), respectively. In the analysis of change in HbA1c stratified by baseline HbA1c, the change was significant for each combination of age-group and baseline HbA1c category (all P < 0.0001 by paired t test). The cutoff of HbA1c <8.0% (<64 mmol/mol) was selected as a measure of adequate HbA1c control set by the Comprehensive Diabetes Care Healthcare Effectiveness Data and Information Set (20).
