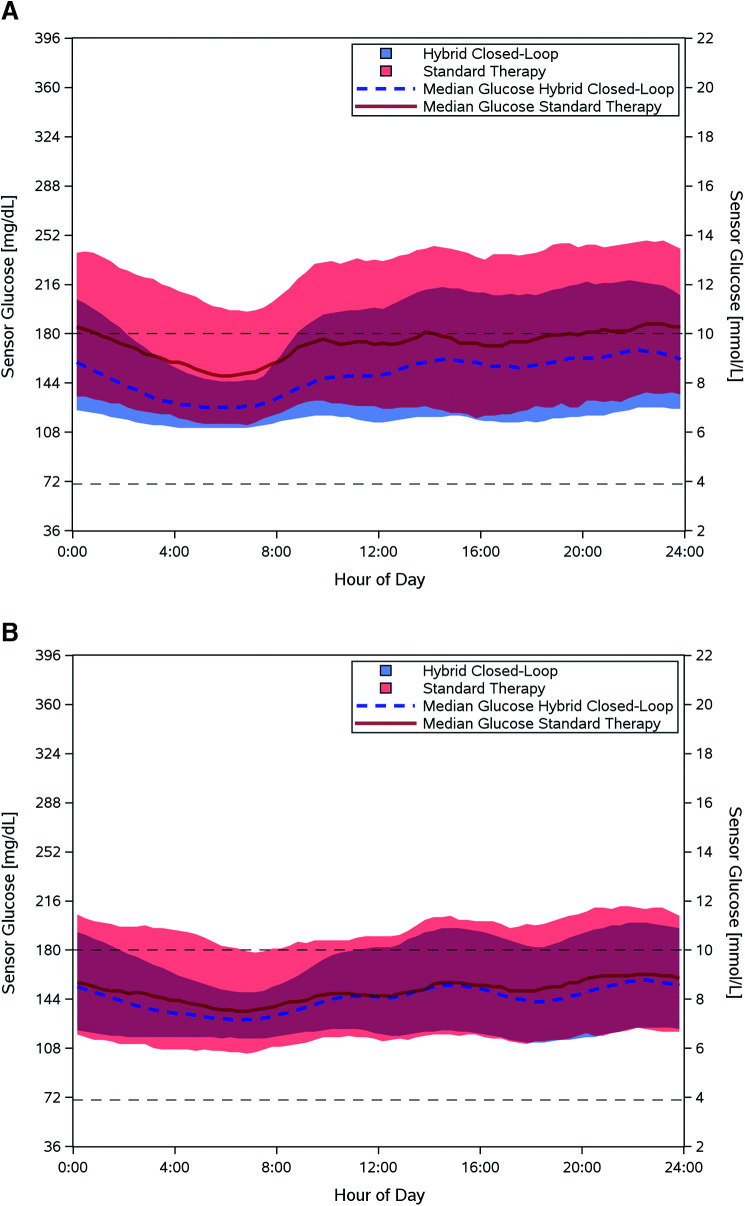
Figure 2.
Sensor glucose measurements. Median sensor glucose measurements are shown for children (age 6–13.9 years, n = 112) (A) and adults (age 14–70 years, n = 128) (B) during the automated insulin delivery phase (blue dashed line) and the standard therapy phase (red line), with blue and red shaded areas indicating the interquartile range for each phase. The target range (70–180 mg/dL) is indicated by black dashed lines. Measurements represent a 24-h period from midnight to midnight.

