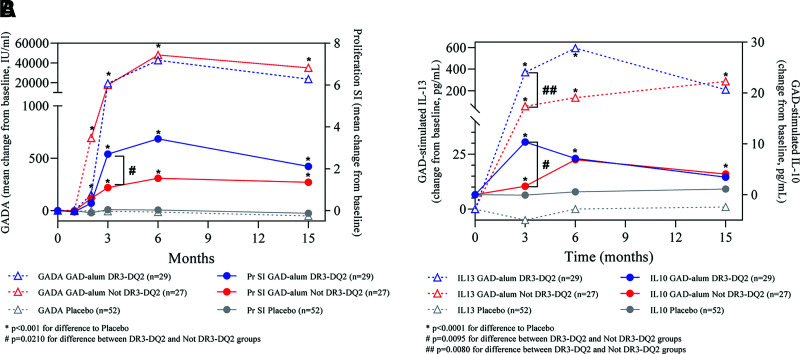
Figure 3.
Pharmacological outcomes. Median changes from baseline of GADA and proliferation (Pr) of PMBC (stimulation index [SI]) (A) and GAD-stimulated secretion by PBMC of IL-10 and IL-13 levels (B) for GAD-alum–treated patients with and without the DR3-DQ2 haplotype as well as placebo-treated patients. P values by Wilcoxon test are indicated.

