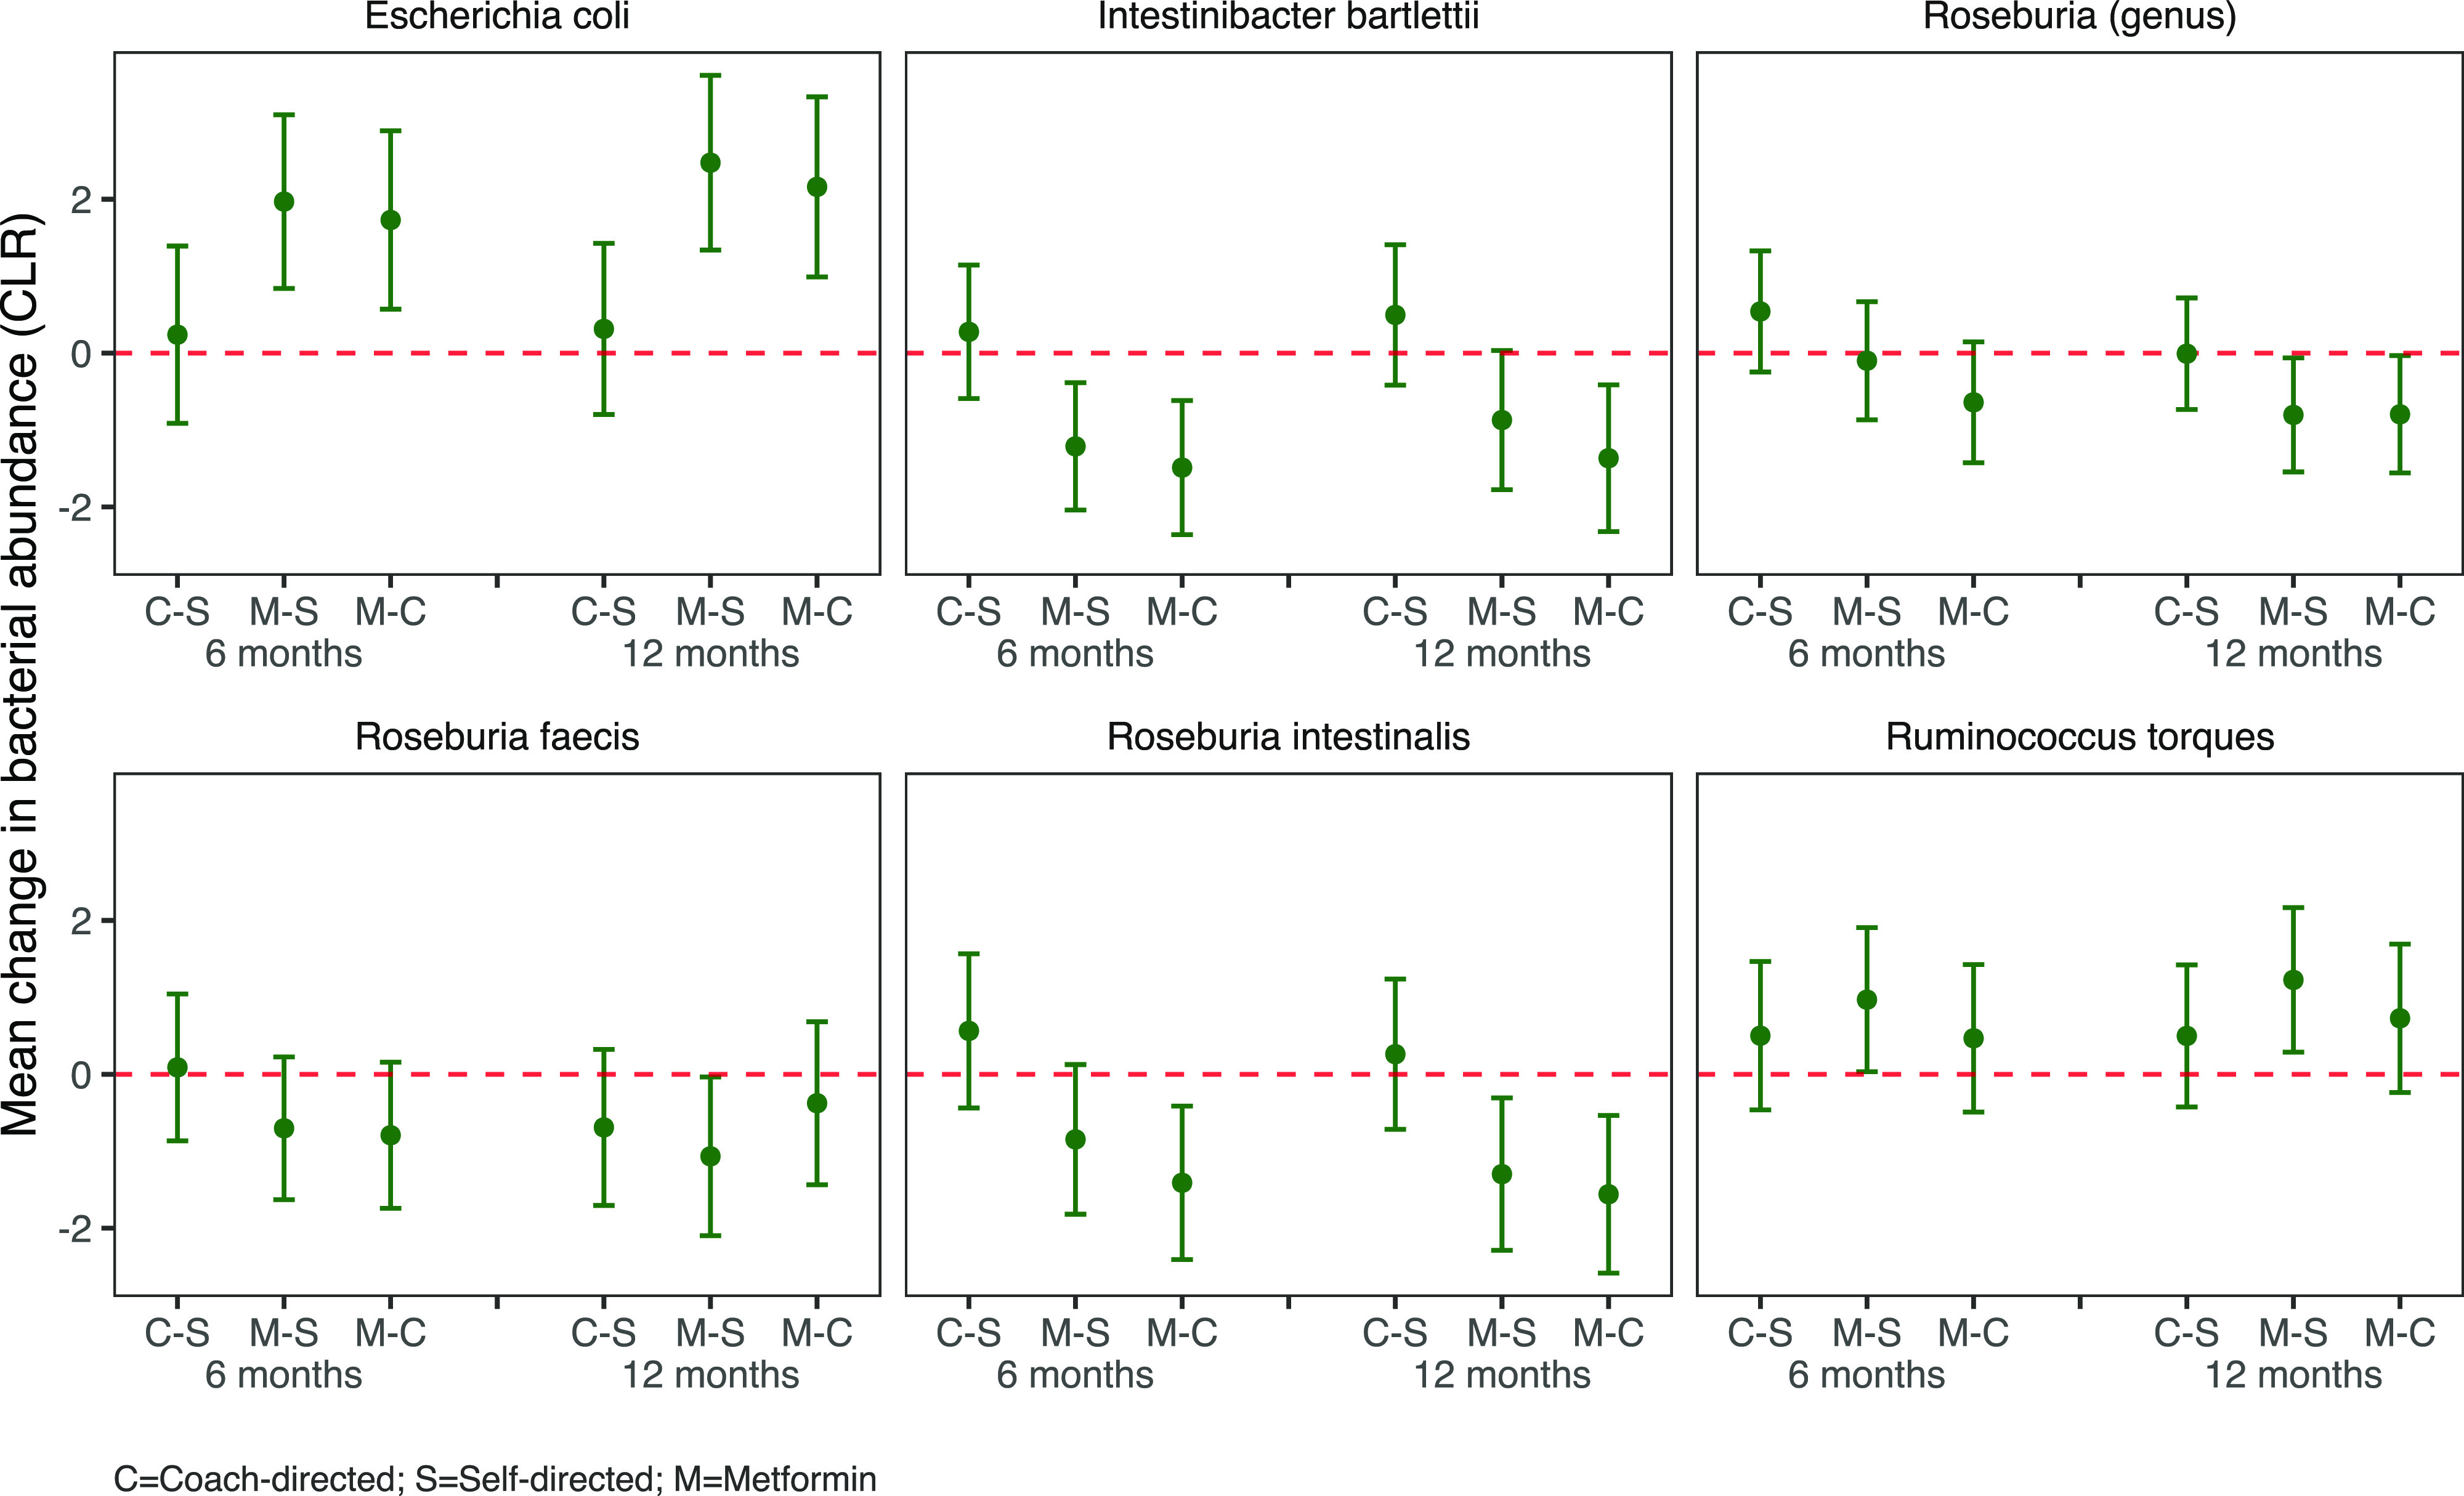
Figure 2.

Comparison of mean change in center log ratio (CLR) transformed bacterial abundances from baseline to 6 months and 12 months between treatment arms. Point estimates and 95% CIs are provided in Supplementary Table 3. Sample sizes by treatment arm: coach-directed (C) baseline n = 35, 6 months n = 35, and 12 months n = 35; metformin (M) baseline n = 38, 6 months n = 38, and 12 months n = 32; and self-directed (S) baseline n = 38, 6 months n = 36, and 12 months n = 38.
