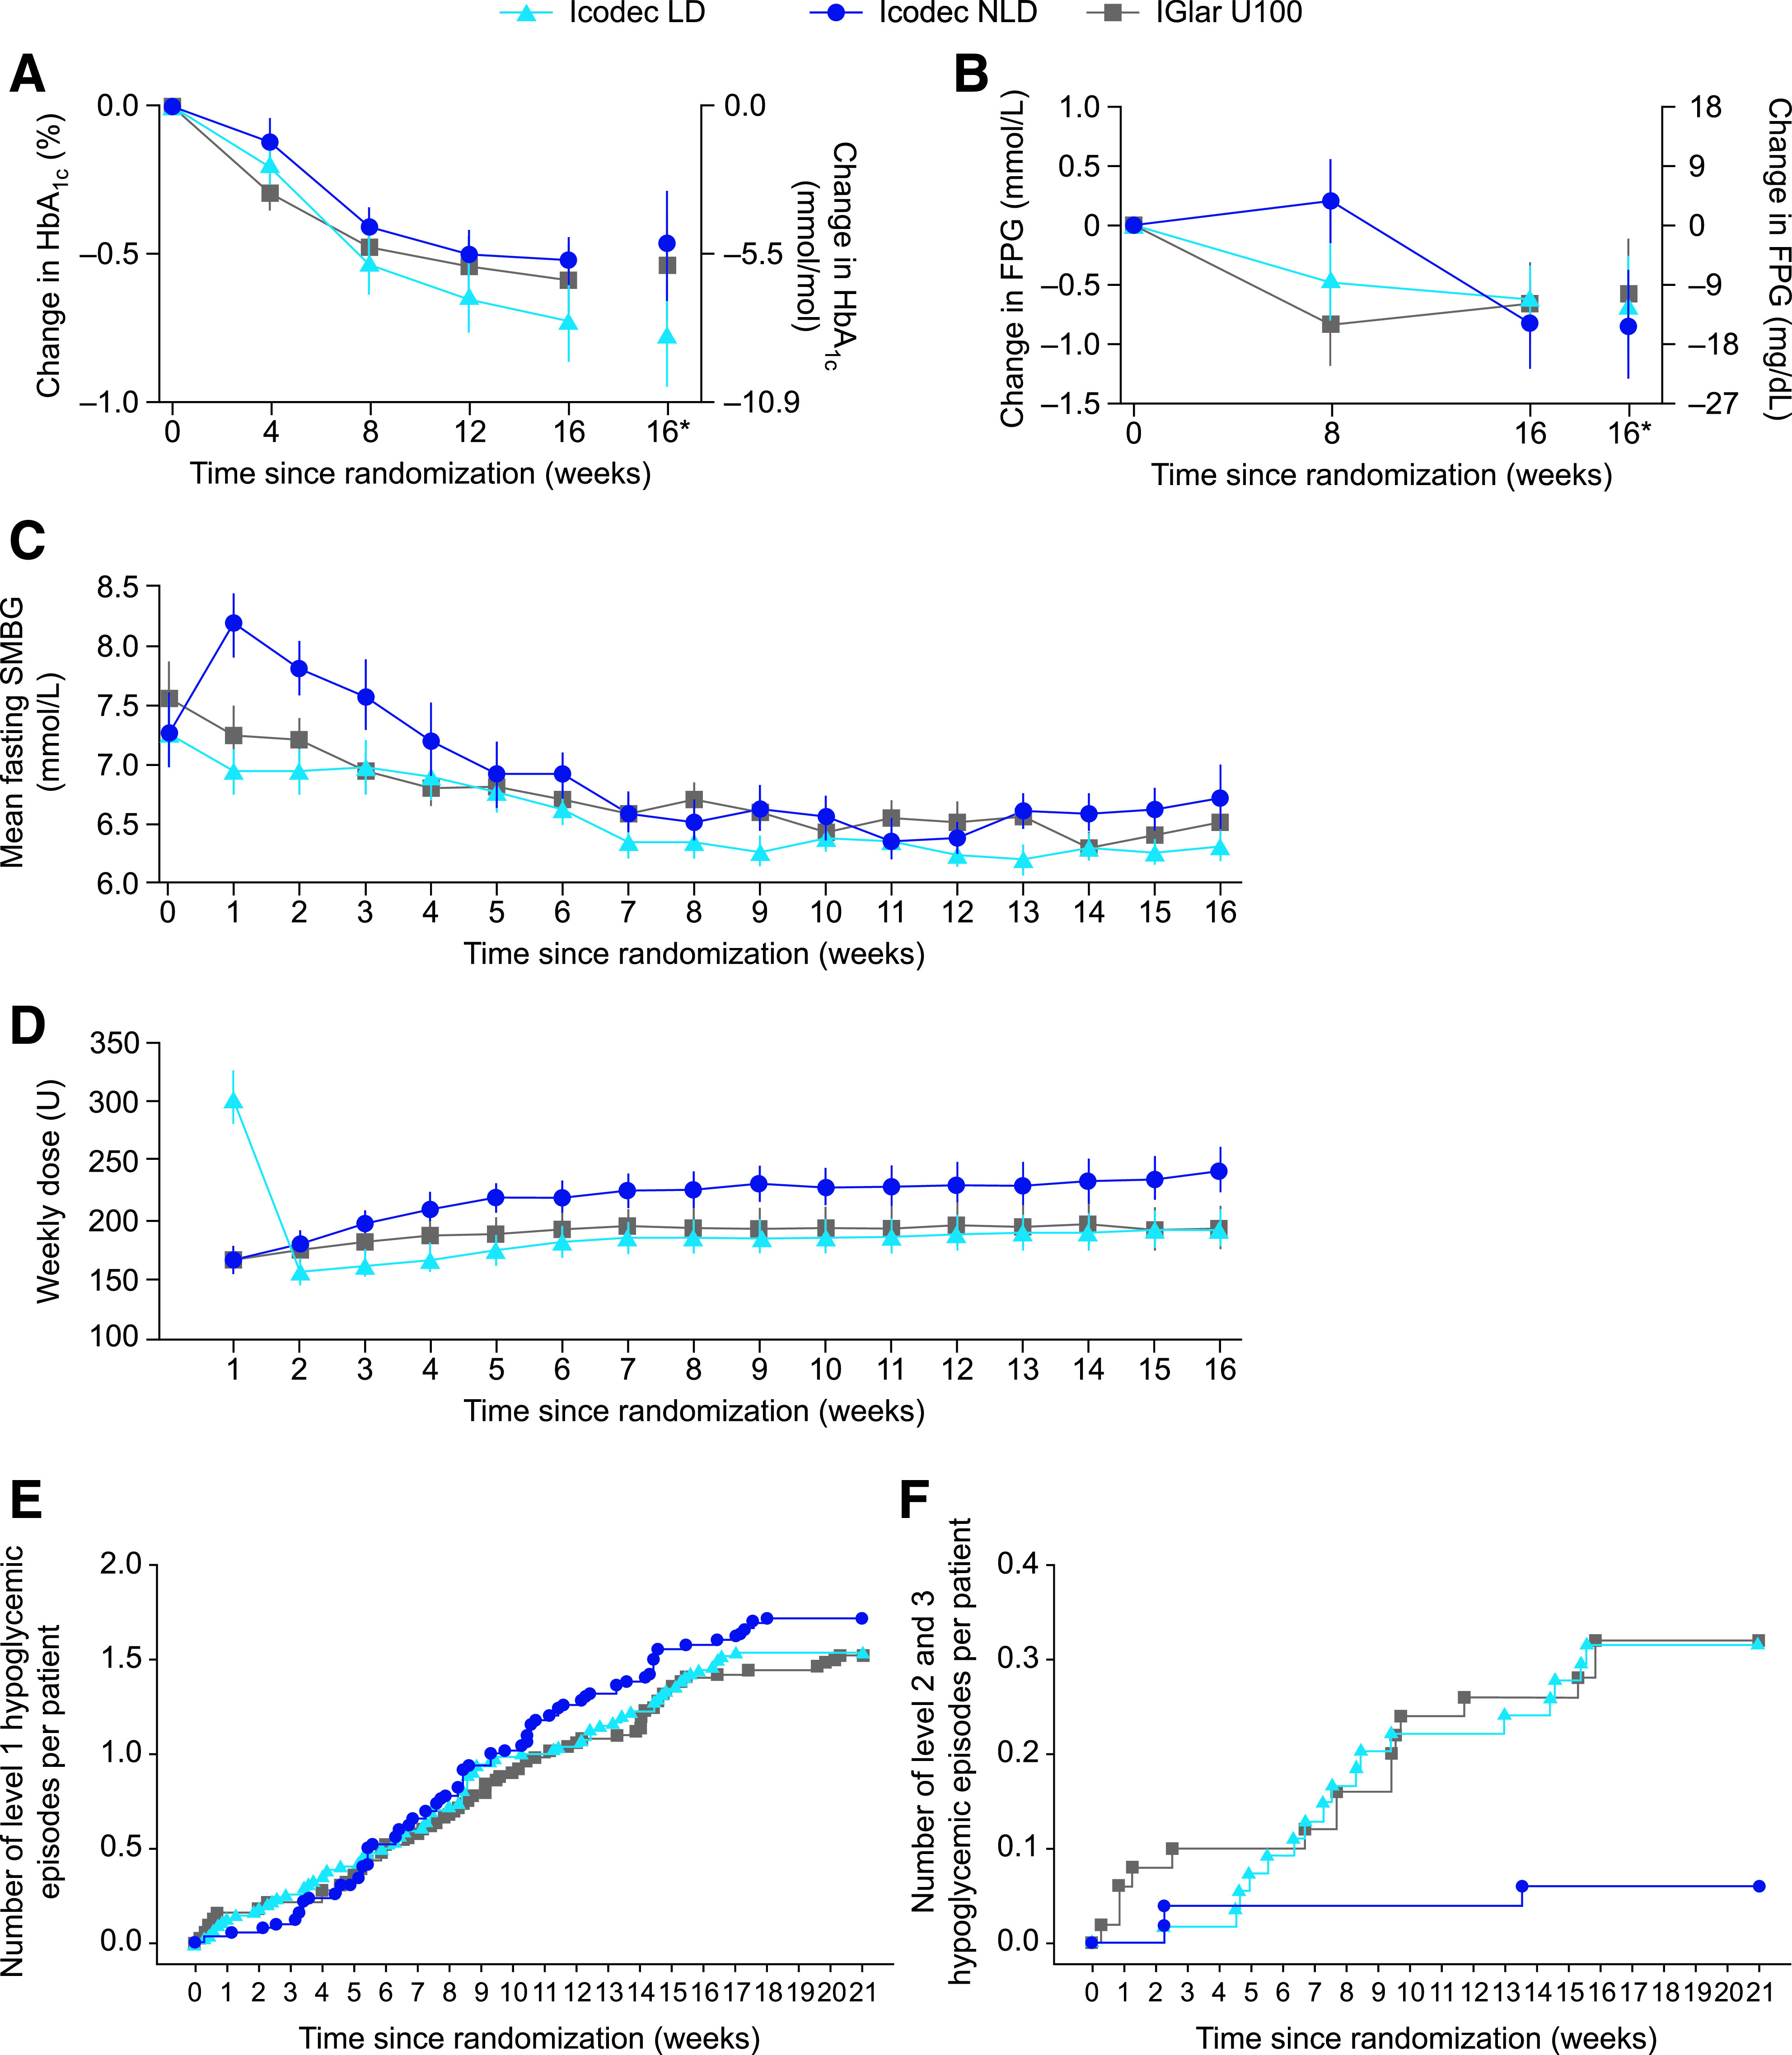
Figure 2.

Key parameters during the trial. A: Mean change in HbA1c from baseline to week 16 (FAS). B: Mean change in FPG from baseline to week 16 (FAS). C: Mean prebreakfast SMBG levels over time (FAS). D: Mean weekly insulin dose over time (FAS). E: Cumulative number of level 1 (“alert” value) hypoglycemic episodes per patient (SAS). F: Cumulative number of level 2 (clinically significant) or level 3 (severe) hypoglycemic episodes per patient (SAS). Observed data. A–C: Mean ± SEM. D: Geometric mean ± SEM on log-scale back transformed. For C, SMBG was assessed with a blood glucose meter as plasma equivalent of capillary whole blood glucose. For D, the dose for a given visit represents the total dose during the preceding week, and weekly IGlar U100 doses were derived as seven times the average daily dose during the preceding week. *Estimated mean values and the corresponding CI at week 16 derived based on multiple imputation. FAS, full analysis set; SAS, safety analysis set; U, unit.
