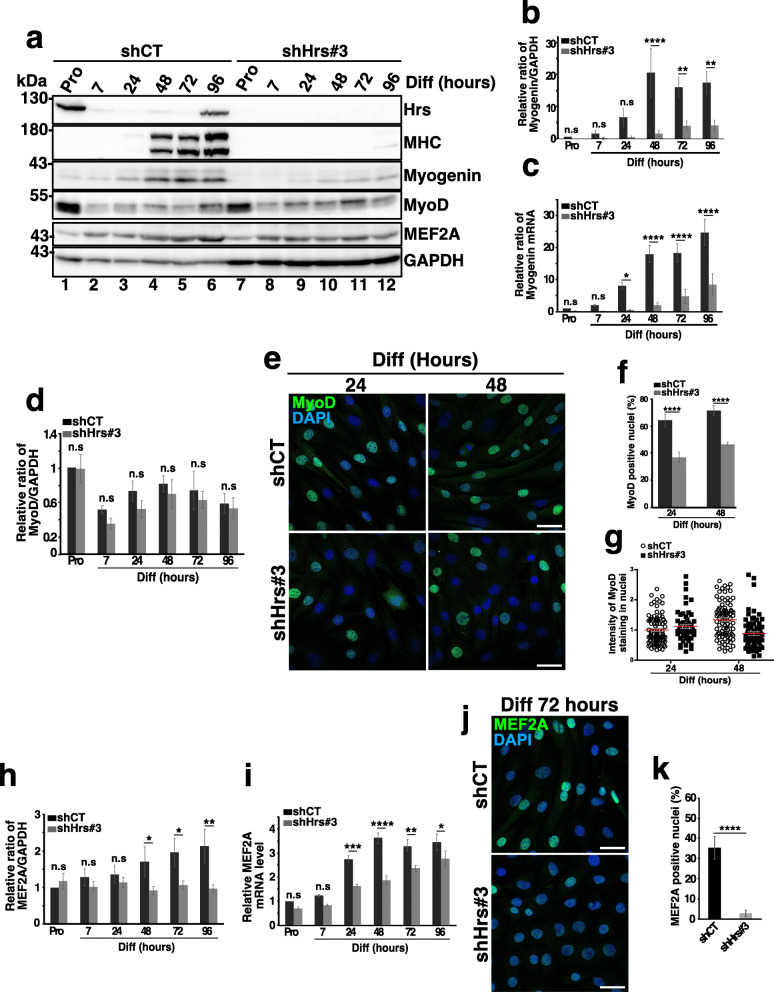
Fig. 4.
Depletion of Hrs affects the expression and localization of the myogenic regulator factors. a Representative Western blotting of shCT and shHrs#3 C2C12 extracts in Pro status (lanes 1 and 7) and at 7, 24, 48, 72, and 96 h of differentiation (lanes 2–6 and 8–12). Membranes were probed with the anti-HRS, -MHC, -Myogenin, -MyoD, and -MEF2A antibodies. GAPDH was used as a loading control. b Quantifications of the myogenin protein level present in experiments like in a. Data are presented as the ratio of myogenin/GAPDH and normalized to the Pro starting point condition. Data represent mean +/− SEM, n = 4 experiments. Significance was assessed using a two-way ANOVA test; **p < 0.01, ****p < 0.0001. ns not significant. c qRT-PCR of myogenin mRNA realized on mRNAs from shCT and shHrs#3 C2C12 cells collected in Pro and at 7, 24, 48, 72, and 96 h of differentiation. Data are normalized to the Pro starting point condition and presented as mean +/− SEM, n = 4 experiments. Significance was assessed using a two-way ANOVA test; *p < 0.05, ****p < 0.0001. ns not significant. d Quantification of the MyoD protein level present in experiments like in a. Data are presented as the ratio of MyoD/GAPDH signals and normalized to the Pro starting point condition. Data represent mean +/− SEM, n = 5 experiments. Significance was assessed using a two-way ANOVA test. ns not significant. e Representative immunofluorescence images of MyoD in shCT and shHrs#3 C2C12 cells at 24 or 48 h of differentiation and probed with anti-MyoD (green) and DAPI (blue). Scale bar, 40 μm. f Quantification of high MyoD-positive nuclei. The data represent mean +/− SEM, corresponding to 9 fields counted per experiment, n = 3 experiments. Significance was assessed using a Mann–Whitney U test; ****p < 0.0001. g Representative quantification of MyoD staining in nuclei. The mean intensity of each positive MyoD nuclei has been measured in each condition. In total, 55–92 nuclei have been counted in each condition. h Quantification of the MEF2A protein level present in experiments like in a. The data are presented as the ratio of MEF2A/GAPDH signals and normalized to the Pro starting point condition. Data represent mean +/− SEM, n = 5 experiments. Significance was assessed using a two-way ANOVA test; *p < 0.05, **p < 0.01. ns not significant. i qRT-PCR of mef2A mRNA from shCT and shHRS#3 C2C12 cells collected in Pro and at 7, 24, 48, 72, and 96 h of differentiation. The data represent mean +/− SEM, n = 4 experiments. Significance was assessed using a two-way ANOVA test; *p < 0.05; **p < 0.01; ***p < 0.001; ****p < 0.0001. ns not significant. j Representative immunofluorescence images of MEF2A distribution (green) in shCT and shHrs#3 C2C12 cells and analyzed at 72 h of differentiation. DAPI staining (blue). Scale bar, 40 μm. k Quantification of high MEF2A-positive nuclei. Data represent mean +/− SEM, corresponding to 7 fields counted per experiment, n = 3 experiments. Significance was assessed using a Mann–Whitney U test, ****p < 0.0001

