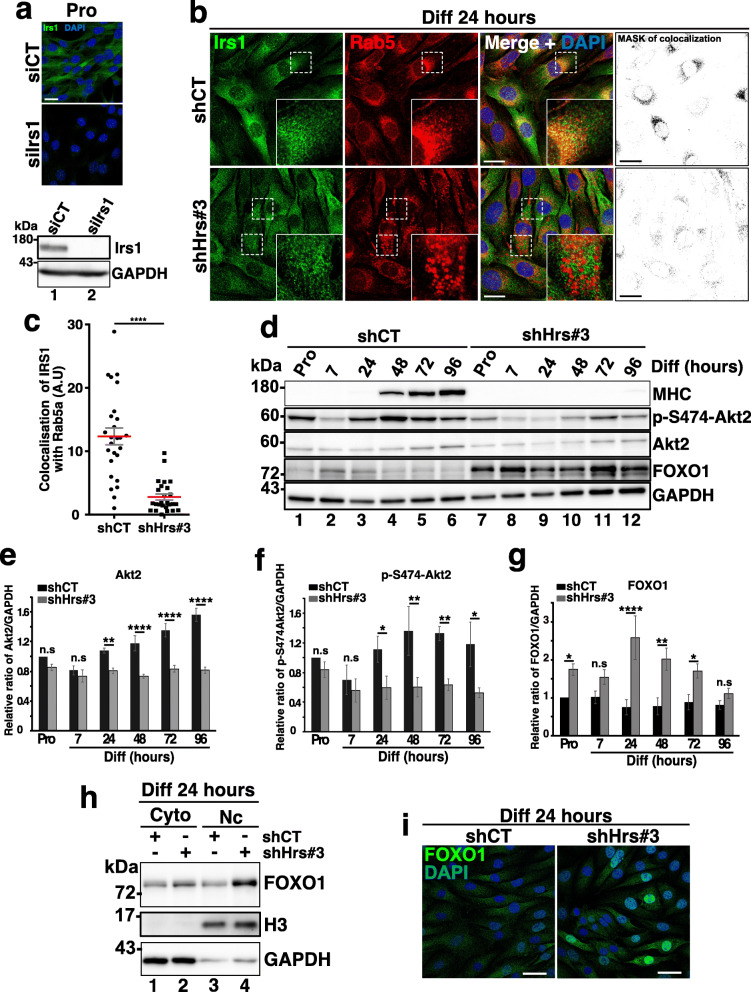
Fig. 7.
Depletion of Hrs downregulates Akt2 signaling and activates FOXO1. a Upper panel: specificity control of Irs1 antibody. Representative immunofluorescence images of siCT and siIrs1 in C2C12, probed with anti-Irs-1 (green) and DAPI (blue). Scale bars, 20 μm. Lower panel: Western blotting of siCT and siIrs1 C2C12 probed with anti-Irs1. GAPDH was used as a loading control. b Left panel: representative immunofluorescence images of shCT and shHrs#3 C2C12 at 24 h of differentiation and probed with anti-Irs1 (green), -Rab5a (red) for EE and DAPI (blue). White dotted squares represent a focus of the selected regions (see insets). The right panel represents the mask of colocalization between Irs1 and Rab5a. Scale bars, 20 μm. c Quantifications of colocalized Irs1/Rab5a as presented in a have been made by creating binary mask between merge channel of Irs1 and Rab5a. Quantification of the signals obtained is presented where one dot corresponds to one image. Data represent mean +/− SEM, 8 images for each group, n = 3 experiments. Significance was assessed using a Mann–Whitney U test, ***P = 0.001. d Representative Western blotting of shCT and shHRS#3 C2C12 extracts collected in Pro (lanes 1 and 7) and at 7, 24, 48, 72, and 96 h (lanes 2–6 and 8–12) of differentiation and probed with anti-MHC, -p-S474-Akt2, -Akt2, and -FOXO1. GAPDH was used as a loading control. e Quantification of total Akt2 protein level in experiments as presented in c. Data are presented as ratio of Akt2/GAPDH signal and normalized to the starting point Pro condition. Data represent mean +/− SEM, n = 3 experiments. Significance was assessed using a two-way ANOVA test; ***p < 0.001; ****p < 0.0001; ns not significant. f Quantification of p-S474-Akt2 protein level in experiments as presented in c. Data are presented as ratio of pS474-Akt2/GAPDH signal and normalized to the starting point Pro condition. Data represent mean +/− SEM, n = 3 experiments. Significance was assessed using a two-way ANOVA test; *p < 0.05; **p < 0.01; ns not significant. g Quantification of total FOXO1 protein level in experiments as presented in c. Data are presented as ratio of FOXO1/GAPDH signal and normalized to the starting point Pro condition. Data represent mean +/− SEM, n = 3 experiments. Significance was assessed using a two-way ANOVA test; *p < 0.05; **p < 0.01; ****p < 0.0001; ns not significant. h Representative Western blotting of nuclear and cytosolic fractionation of shCT and shHrs#3 transduced C2C12 at 24 h of differentiation and probed with the anti-FOXO1, -H3 (for nuclear marker). GAPDH was used as a loading control. i Representative immunofluorescence images of shCT and shHrs#3 C2C12 at 24 h of differentiation and probed with anti-FOXO1 (green) and DAPI (blue). Scale bars, 40 μm

