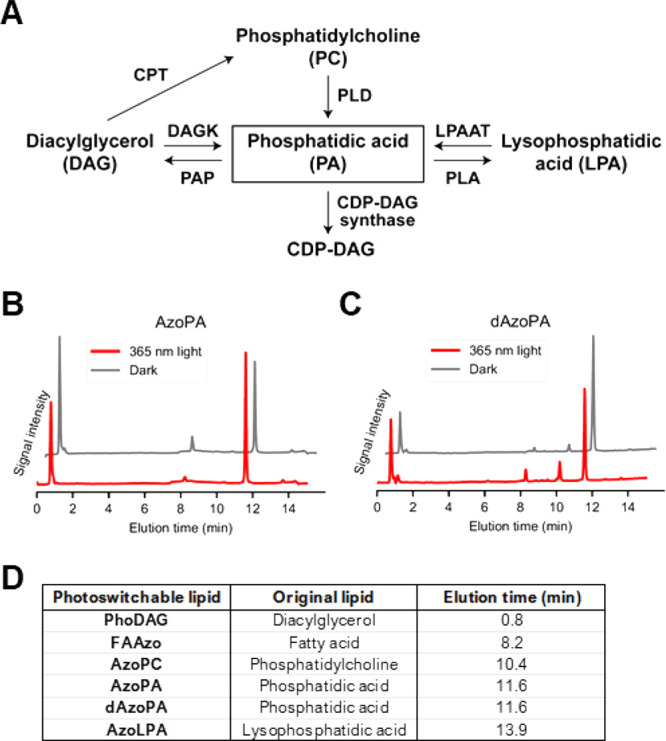
Figure 3.

Characterization of cellular uptake and metabolism of AzoPA and dAzoPA. (A) Schematic diagram of mammalian PA metabolism. CDP: Cytidine diphosphate, CPT: cholinephosphotransferase, DAGK: diacylglycerol kinase, LPAAT: lysophosphatidic acid acyl transferase, PAP: phosphatidic acid phosphatase, PLA: phospholipase A, PLD: phospholipase D. (B,C) HPLC trace of lipid extracts from NIH 3T3 cells treated with 20 μM AzoPA (B) or dAzoPA (C) in the light-induced cis form (red) or dark-adapted trans form (gray) for 1 h. Just prior to the analysis, all samples were irradiated with 460 nm light to switch azobenzene moieties into the trans forms and normalize the absorption. (D) Observed elution times of standard photolipid molecules on HPLC.
