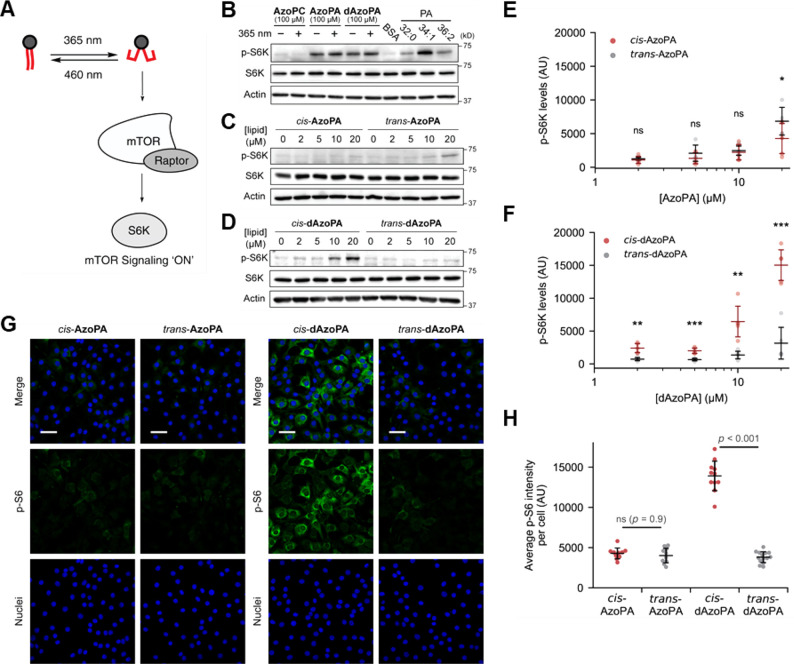
Figure 4.
Optical control of mTOR signaling in NIH 3T3 cells. (A) Schematic depiction of the optical control of mTOR activation induced by PA. (B) Western blot analysis of NIH 3T3 cells treated with BSA (4 mg/mL) or indicated lipids (100 μM) for 1 h, probing for p-S6K, S6K, or actin as a loading control. (C,D) Western blot analysis of cells treated with AzoPA (C) or dAzoPA (D) in their light-induced cis form or dark-adapted trans form at different concentrations (0–20 μM) for 30 min. (E,F) Quantification of p-S6K levels in (C) and (D). Horizontal bars indicate mean (n = 6), and vertical error bars indicate standard deviation. Statistical significance was calculated using an unpaired two-tailed Student’s t test. *, p < 0.05; **, p < 0.01; ***, p < 0.001. (G) Confocal microscopy images of NIH 3T3 cells treated with the indicated lipids (5 μM) for 30 min and immunostained for p-S6. Green, p-S6; blue, DAPI (nuclei). Scale bars: 50 μm. (H) Quantification of immunofluorescence analysis. The plots show average p-S6 intensity per cell in each image. Black horizontal bars indicate mean (n = 10–14), and vertical error bars indicate standard deviation. Statistical significance was calculated using one-way ANOVA, followed by Tukey’s HSD test.

