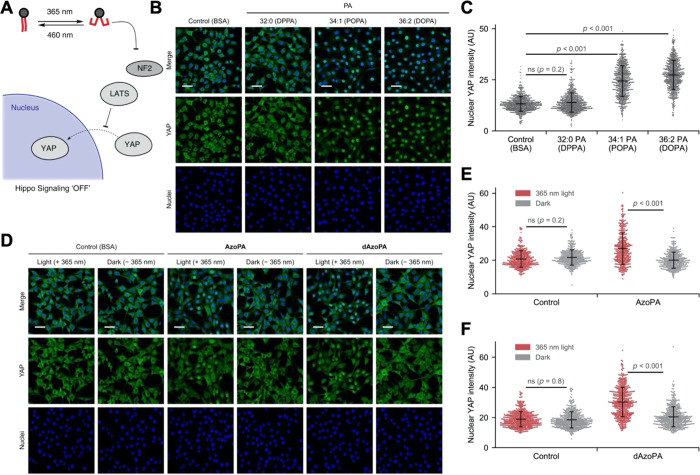
Figure 5.
Optical control of Hippo signaling in NIH 3T3 cells. (A) Schematic depiction of the optical control of Hippo deactivation induced by PA. (B) Confocal microscopy images of NIH 3T3 cells treated with BSA (4 mg/mL) or the indicated lipids (50 μM) for 1 h and immunostained for YAP. (C) Quantification of nuclear YAP levels in (B). The plots show mean nuclear YAP intensity in each cell. Black horizontal bars indicate mean (n = 645), and vertical error bars indicate standard deviation. (D) Confocal microscopy images of NIH 3T3 cells treated with BSA (4 mg/mL) or indicated lipids (10 μM) for 1 h with or without 365 nm light (5 ms every 15 s) and immunostained for YAP. (E,F) Quantification of nuclear YAP levels in (C) and (D). The plots show mean nuclear YAP intensity in each cell. Black horizontal bars indicate mean (n = 342 (C) and 465 (D)), and vertical error bars indicate standard deviation. Statistical significance was calculated using one-way ANOVA, followed by Tukey’s HSD test. Green, YAP; blue, DAPI (nuclei). Scale bars: 50 μm.

