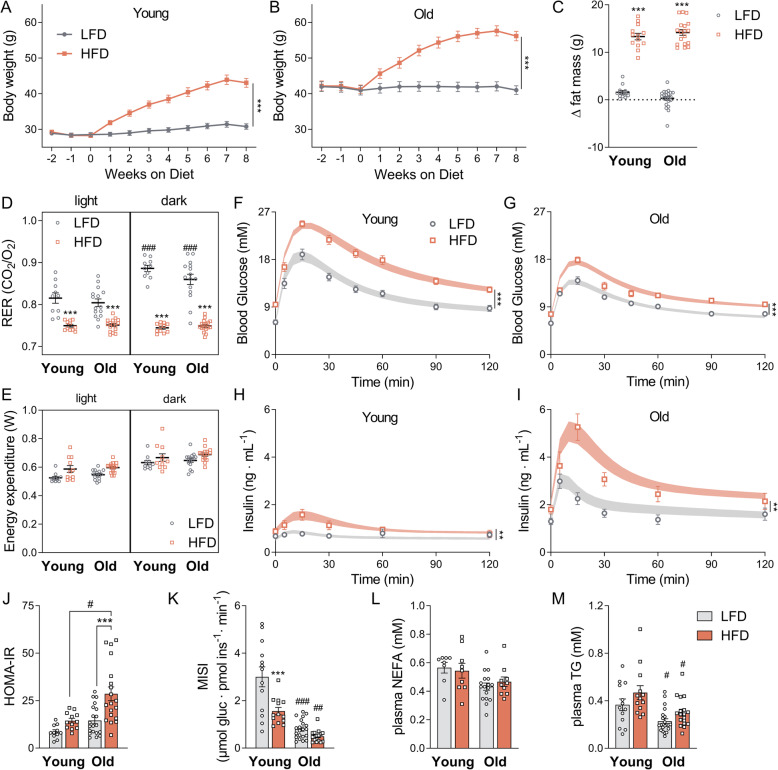
Fig. 1.
Aged mice are more susceptible to develop diet-induced insulin resistance. a, b Weight increase during 8 weeks in young and old mice, respectively, when submitted to either a LFD or HFD. c Increase in fat mass after 8 weeks on a HFD. d Average respiratory exchange ratios (RER) in both light/dark phases following 11 weeks on each diet. e Energy expenditure in both light/dark phases after 11 weeks on each diet. Data were corrected with ANCOVA with BW as a covariate for both light phases in old and aged mice (adjusted body weight = 45 g). Plasma glucose concentrations for young (f) and old (g) mice and plasma insulin levels for young (h) and old (I) mice are plotted for 120 min following an oral glucose tolerance test (OGTT) (1.5 g/kg BW glucose), performed after 9 weeks on either a LFD or a HFD. The points represent experimental data, and fitted curves are summarized in the shaded area. j HOMA-IR indexes adjusted to mice were calculated from the OGTT data as [fasting glucose in mM] × [insulin in mU/L]/14.1. k Muscle Insulin Sensitivity Index (MISI) calculated from fitted glucose and insulin curves, adapted from O’Donovan et. al. [22]. l, m Plasma non-esterified fatty acids (NEFAs) and triglycerides (TG). Data are shown as mean ± SEM. Statistical analysis was conducted for each group according to the “Materials and Methods” section, n = 10–13 (young groups) or 15–22 (old groups); ###p < 0.001 (old vs young), ##p < 0.01 (old vs young), #p < 0.05 (old vs young), ***p < 0.001 (LF vs HF), **p < 0.01 (LF vs HF), *p < 0.05 (LF vs HF). Each pairwise comparison analysis means that differ by only one factor, meaning that age comparisons have matched diet and diet comparisons have matched age. Supporting data values can be found in Additional file 10.

